


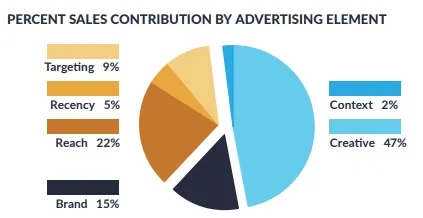
Creative, not media spend, is what decides whether your campaigns scale or stall. Nielsen attributes 47% of sales lift to creative quality, and Google estimates it closer to 70%.
Even with the best media buying platforms and targeting options, you can’t compensate for weak or untested creative.
You’ve seen it firsthand. Creative fatigue sets in fast, engagement signals fragment across platforms, and ad variations that succeed in one market often collapse in another.
Without advanced systems like A/B testing, multivariate testing, and geo-splits, you lose consistency. Marketing budgets slip away, and return on ad spend suffers.
In this guide, you’ll see how you can build creative testing frameworks that deliver reliable test results and extend the life of performance creative. You’ll also explore how to scale winning creative assets into repeatable growth worldwide.
We’ll cover:
P.S. Are your ad creatives performing in one market but flatlining in another? That’s a testing problem, not a talent one. Fieldtrip integrates strategy, creative, media, and measurement into one system. So you can get smarter tests, faster campaign optimization, and clear visibility into performance creative ROI.
Let’s talk about scaling your ad testing with Fieldtrip.
You probably already know that creative testing goes well beyond basic A/B tests. At your enterprise level, it means running controlled experiments that reveal how creative elements affect performance. Ad formats, copy variations, and audience targeting shifts all influence cost per acquisition, return on ad spend, and paid media results.
Reliable methods like multivariate testing, geo-splits, and sequential testing help surface insights that scale.
You may have seen in your own campaigns that the real challenge is turning tests like these:
Into a system that works globally.
This requires mapping creative fatigue curves, standardizing test design, and tracking performance creative against metrics like brand lift and engagement rate. When structured correctly, creative testing becomes a repeatable process for scaling winning creative assets across markets.
As you know, testing one ad set in one market doesn’t tell you much. At your scale, every advertising campaign runs across regions, platforms, and cultural moments. Without scalable creative ad testing, you end up with fragmented insights that don’t translate into global performance gains.
Let’s break down why scalable testing matters and where the biggest challenges show up for enterprise brands.
When you launch ad creatives across regions, you test against entirely different audience targeting patterns, emotional responses, and cultural moments.
A funny TikTok ad that delivers a 3% engagement rate in North America might decay to 1% within weeks in Germany.
A surface-level read would blame “market differences.” But when you map this in a structured test matrix, the story becomes clearer:
Similarly, a creative concept that drives a strong click-through rate in English could underperform once localized if the tone misses the cultural context.
This is where a structured test matrix becomes critical. Running geo-split or sequential testing across markets helps you isolate performance variables and see whether a lift in one region actually holds elsewhere.
When you tie those test results back to return on ad spend, you move from anecdotal wins to scalable learning. It allows you to build creative assets you can roll out confidently across global ad sets.
You’re running creative testing across Paid Social, search, CTV, OOH, and programmatic, all at once. Each channel brings unique signal patterns and measurement gaps. What soars on social in terms of engagement could barely move the needle in CTV, where completion rate and emotional response rule the day.
As Nielsen puts it:
“When a campaign isn’t delivered to a buyer target, the creative has to work even harder to drive sales.”
That’s exactly the challenge across fragmented channels, when targeting isn’t perfect, your creative assets carry the performance load.
According to eMarketer, 78% of marketers run both social and CTV ads. Yet only about a quarter (24%) create entirely different creatives for each channel. Most just tweak the length or format and call it a day.
That’s a red flag when completion rates on CTV sit around 90-98%, compared to sub-30% on social video.
What these numbers reveal is clear: siloed test results don’t cut it. A unified testing matrix, mapping creative assets across channels and tying them to comparable metrics like return on ad spend, is essential.
You start to see whether a concept scales or collapses in real-world usage. Without that, you're just inflating budgets in one channel while bleeding performance in another.
You’ve likely experienced the tension between your brand teams, performance teams, and regional leads.
Brand wants consistent creative concepts, performance needs cost-per-acquisition gains, and regional leads demand cultural nuance. Misalignment doesn’t just slow things down; it bleeds performance.
The numbers speak for themselves. Companies with strong alignment between marketing and sales see a 208% jump in marketing-driven revenue and 15% higher profitability. When teams aren’t aligned, up to 60–70% of created marketing content goes unused. Those misplaced assets are sitting in cost centers, instead of growth drivers.
That’s why you need a creative testing operating model that serves every stakeholder. You bring clarity to creative asset sourcing, standardize test matrix designs, and start sharing creative analysis in real time.
When everyone works off the same framework, you turn siloed test results into unified wins and scale performance creative faster across markets.
As you already know, the stakes rise sharply when testing at enterprise scale. One off-brand placement or compliance misstep doesn’t just hurt your performance; you risk losing credibility or facing regulatory blowback.
Privacy rules have tightened testing conditions.
Since the iOS 14.5 update, the entire approach to tracking and attribution has shifted. It has made it harder to measure creative performance with the same precision. Add GDPR in Europe, CCPA in California, and emerging policies in APAC. Your test matrix can collapse if it is not built with compliance in mind from the start.
Brand safety adds another layer. TikTok, for example, now offers marketers independent oversight using third-party verification tools.
In one case, KFC ran a global in-feed ad campaign that delivered 17.8 million impressions with a 99.5% verified safe delivery rate. Thanks to TikTok’s Inventory Filter and post-campaign brand safety checks. That’s performance and peace of mind working together.
Therefore, always treat compliance as another performance lever, instead of a checkbox. Align your creative testing frameworks with targeting guardrails, data governance, and brand guidelines. That way, every test, across formats, markets, and ad sets, is both scalable and safe.
You already track performance across channels, but remember, not every metric tells you the full story. At your enterprise scale, the real challenge is deciding which signals matter for scaling creative concepts and which are just noise.
So, let’s break it down.
CTR, video completion, and scroll-stop rates are signals you already track. But the key is knowing how to turn them into performance levers.
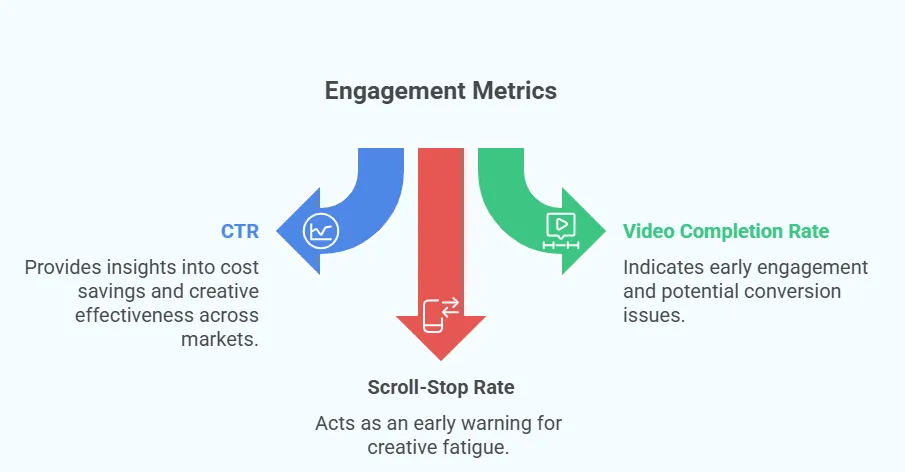
Take CTR. On its own, a +1% lift doesn’t tell you much. But when you apply it across thousands of ad sets and multiple markets, that lift can cut cost per acquisition by double digits.
For example, a short UGC clip outperforms a polished studio ad, scaled across a region. That slight CTR edge translates into millions saved. The real insight comes from segmenting CTR by creative variation and comparing outcomes against ROAS. That’s where you see which creative concepts sustain scale.
Video completion rate is another lever. Instead of just logging completions, tie completion curves to downstream conversion data.
Meta found that 47% of a video campaign’s value is delivered in the first 3 seconds. If your creative drops a third of viewers at that point, you already know conversions will suffer downstream.
Treat completion curves as an early stress test; weak performance signals the need to adjust creative elements before scaling spend.
Scroll-stop rate works the same way. Don’t just track it; layer it into your test matrix as an early fatigue indicator. When scroll-stops begin to dip, it’s a leading signal that your ad creatives are decaying, long before cost per result balloons.
This gives you a buffer to swap in fresh creative assets or re-seed with user-generated content without burning budget.
Cost per acquisition, return on ad spend, and lifetime value are the ultimate performance signals. You already track them, but the key is integrating them into your creative testing blueprint instead of treating them as lagging reports.
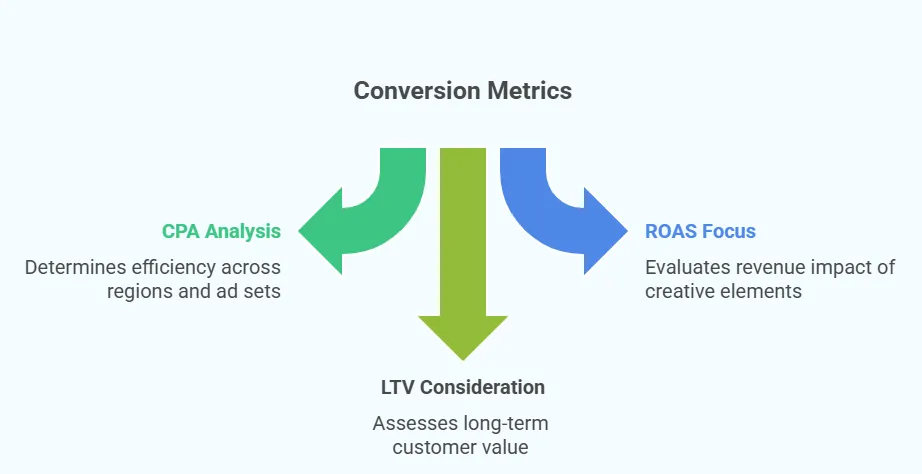
CPA shows whether a creative variation is efficient enough to scale. Picture two ad creatives: one with a slick studio shoot and another raw UGC clip.
If the UGC drives a 20% lower CPA in one market, it looks like a winner. But unless that efficiency holds across multiple regions and ad sets, it’s a false signal.
That’s why CPA needs to be analyzed within structured test matrices.
ROAS brings the revenue side into focus. A carousel ad that drives a spike in CTR but lowers ROAS is not a win. It is a wasted budget.
Consider a fashion brand running a flashy product carousel. It drives clicks, but shoppers bounce before purchase. Meanwhile, a simpler single-image ad highlights a best-seller and delivers stronger ROAS.
The insight comes from mapping creative elements directly to incremental revenue impact. Multivariate testing or lift testing helps you see if that higher ROAS comes from the creative itself or external factors like bid strategies.
LTV completes the picture. Imagine a flashy discount ad that brings in buyers who spend heavily in week one but churn by month’s end. On paper, it looks efficient. Now compare that to a higher-cost lifestyle video that drives fewer sign-ups upfront but attracts repeat buyers for six months. The second creative outperforms over time.
That’s where LTV analysis elevates testing from tactical tweaks to enterprise-scale decision-making.
Ad recall, brand lift, and sentiment tracking sometimes get sidelined in performance conversations. But at your enterprise scale, they’re critical signals. They show whether your creative concepts do more than convert. They build brand equity that sustains long-term performance.
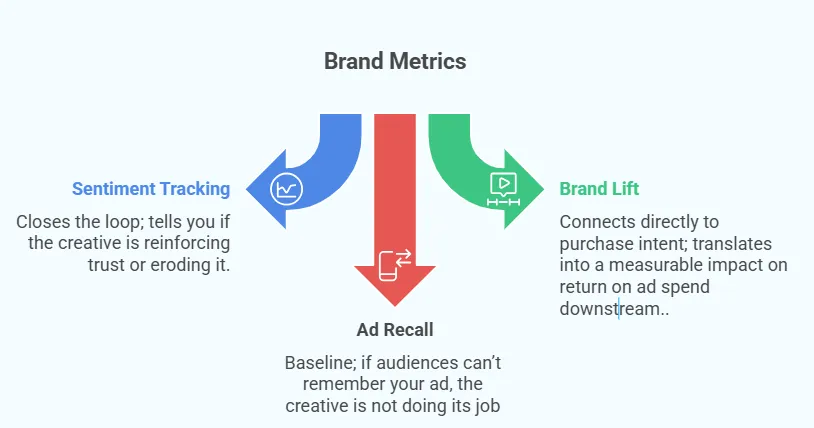
Ad recall is the baseline. If audiences can’t remember your ad, the creative is not doing its job. For example, a CTV spot that delivers high completion but zero recall in follow-up surveys, that’s wasted reach. Strong recall means the creative elements landed and primed future conversions.
Brand lift connects directly to purchase intent. A campaign that improves brand lift by even 3–5 percentage points mostly translates into a measurable impact on return on ad spend downstream.
For example, social ads testing emotionally resonant messaging in a split test might raise purchase consideration from 22% to 27%. That five-point lift proves creative value before you commit media budgets to a global scale.
Sentiment tracking closes the loop. Monitoring responses on social ads or through digital behavioural measures tells you if the creative is reinforcing trust or eroding it.
Consider a campaign built around polarizing visuals: engagement rate jumps 25%, but positive sentiment drops from 68% to 54%. That offset wipes out the gain.
When you combine sentiment data with lift testing, it helps you decide which creative assets to scale and which to retire early.
You’ve seen it before: a new ad creative launches, delivers strong CTR and CPA in the first week, then drops fast as impressions stack up. That’s creative fatigue in action. Without tracking decay curves, you don’t know when efficiency begins to erode, and you end up overfunding ad sets that are already past their peak.
Data shows that the average viewer sees the same ad 4.2 times in a 30-day window. Push that frequency higher, and decay accelerates.
Another study found that users who saw an ad 6–10 times were 4.1% less likely to buy compared to those exposed only 2–5 times. These figures underline how quickly fatigue erodes performance once frequency climbs.
The fix is treating fatigue as a measurable performance variable. Plot engagement rate, CTR, and cost per result over time for each creative variation.
A decay curve that shows CTR falling 40% after 200,000 impressions is a signal to rotate in fresh creative assets. On the flip side, if user-generated content holds stable performance past 500,000 impressions, you’ve got proof that it scales more sustainably than polished studio assets.
When you build fatigue curves directly into your test matrix, you get real-time feedback. This tells you when to explore new creative concepts and when to keep exploiting existing winners. That’s how enterprise teams extend the life of performance creative without burning budget.
Now that you’ve seen why scalable testing matters and which metrics actually drive performance, let’s move into how you can structure creative testing at scale.

Every test starts with a goal. Awareness, engagement, conversion, or brand lift, each demands a different structure. If you test without clarity, you risk collecting data that looks impressive on paper but can’t be applied to campaign optimization.
For example, if the objective is awareness, you’ll measure lift in ad recall or sentiment, not only CTR. If it’s a conversion, then CPA and ROAS become the anchor metrics.
Consider a retail brand testing video ads: one group optimizes for brand lift in purchase consideration, while another tracks CPA on the same creative set. Both generate results, but they can’t be compared or scaled because the outcomes are misaligned.
We’ve seen enterprise teams run into trouble when they chase every KPI at once. Our suggestion is to pick one primary outcome per test and design your creative variations, ad formats, and targeting options around that.
The biggest mistake is treating “engagement” as a universal goal. A strong engagement rate without downstream conversion or brand lift often misleads teams into scaling creative that can’t sustain performance.
Once your goal is set, the testing method decides how reliable your results will be.
The best-performing enterprise teams don’t default to one method. They build a test matrix that matches the campaign scale and audience size.
Reliability comes down to numbers: an A/B test with 50,000 impressions per cell may be statistically solid, but stretch the same framework to a global rollout and you risk underpowered results.
For example, if you’re validating performance creative for a global launch, a geo-split can show whether an ad concept that drops CPA in Europe holds the same effect in APAC.
If you’re refining creative elements inside a single ad format, multivariate testing helps you isolate whether headline copy or visual cues are driving ROAS.
Sequential monadic testing is also valuable when you need to measure emotional response without cross-contamination from other ads.
We use the same approach at Fieldtrip. Here’s a static test we ran for Hurom: visuals stayed identical, but the hooks shifted.
One version opened with “Glow Up. Slim Down.” and emphasized energy, gut health, and effortless daily use.

The other led with “This Is Your Year of Transformation” and focused on immunity, weight loss, and energizing the body.

Running multiple text options per creative, while holding imagery constant, let us see which benefit stack held attention and scaled across ad sets.
“Hooks testing is like the main core of our creative testing, and as for Texts, Headlines, and CTA's. We also mostly use at least 3 different text options per creative, and we optimize later depending on results.” Mustafa M. Ali, Paid Marketing Lead at inBeat Agency
Side Note: Treat method selection as a performance variable itself. The wrong method inflates results and wastes budget. However, the right one gives you test results you can roll out with confidence across Paid Social, search, and programmatic.
The next step is creating variants that can actually answer the test. At your scale, this means designing creative assets with just enough variation to isolate what’s driving performance, without introducing noise.
User-generated content, branded creative, and multiple ad formats all belong in your mix. UGC often wins on authenticity, while branded assets deliver polish and consistency. The key is structured variation.
Run a UGC clip against a branded video with the same copy, CTA, and offer. When you hold everything else constant, you know the performance delta comes from the creative source, instead of another variable.
Where teams slip is overloading the matrix.
If you change imagery, copy, and targeting all at once, you build noise into the test. Keep it disciplined. Shift one element at a time, whether that’s imagery, headline, or CTA.
With 2 to 4 variants per test and ~50K impressions per cell, you’ll generate results that are statistically reliable without spreading budget too thin.
Here’s a clean setup you can apply:
In this setup, Variant A clearly wins. The CTR edge translates into a $6 lower CPA and stronger ROAS compared to the branded alternatives.
That’s the type of signal you can scale across Paid Social and programmatic with confidence.
We’ve applied the same approach in practice. In one test, we worked with multiple creators, each producing a single video, and ran them against defined US audience segments:
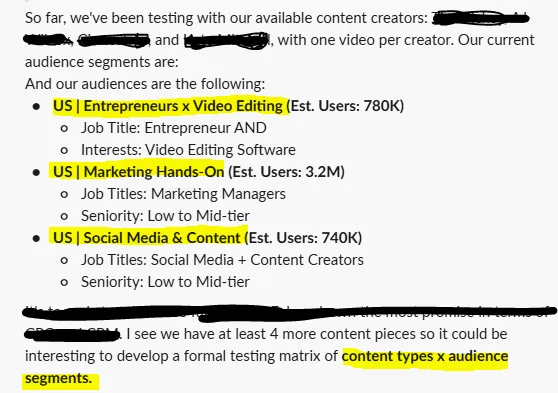
So, we ended up creating a content type × audience segment matrix, which revealed clear performance differences in CPC and CPM across cells.
Here’s a template you can use:
Here’s how to interpret the matrix:
The takeaway is simple: testing fewer, sharper variants preserves statistical power and delivers insights you can scale confidently across Paid Social and programmatic.
Your test results are only as strong as the data behind them. Too few impressions, and you chase noise. Too many, and you waste budget.
At scale, you’ll want 50K–100K impressions per variant to trust directional outcomes. Geo-splits mostly demand millions to smooth out regional volatility. What matters is hitting statistical significance at a 90–95% confidence level.
Budgets work the same way.
A creative that lowers CPA in a small ad set doesn’t prove scalability. Spend must be high enough to stress-test performance under real conditions. We’ve seen creatives collapse once investment scaled past 20% of Paid Social spend because the audience pool was too thin.
We suggest splitting the budget between exploitation and exploration. Keep most spend on proven winners, while reserving 15–20% for testing new variants.
For example, in a $1M campaign, $800K fuels winning creatives while $200K powers structured testing. This balance builds a pipeline of future winners without eroding efficiency.
Running tests is only half the job. The real value comes from reporting results consistently against the metrics you’ve defined upfront, CPA, ROAS, LTV, brand lift, or sentiment.
We suggest you lock reporting into a standardized template so every region and team speaks the same language. Without that discipline, you risk chasing conflicting data sets that can’t scale.
Consistency also exposes creative fatigue early.
Weekly trend reports showing CTR, scroll-stop rate, and cost per result will show when a winning creative is starting to decay. This gives you time to rotate in new variants before efficiency drops. Also, it keeps the pipeline of performance creative always-on.
At your level, creative testing can’t be a side project; it has to operate as a system. Here are the frameworks we suggest you put on repeat:
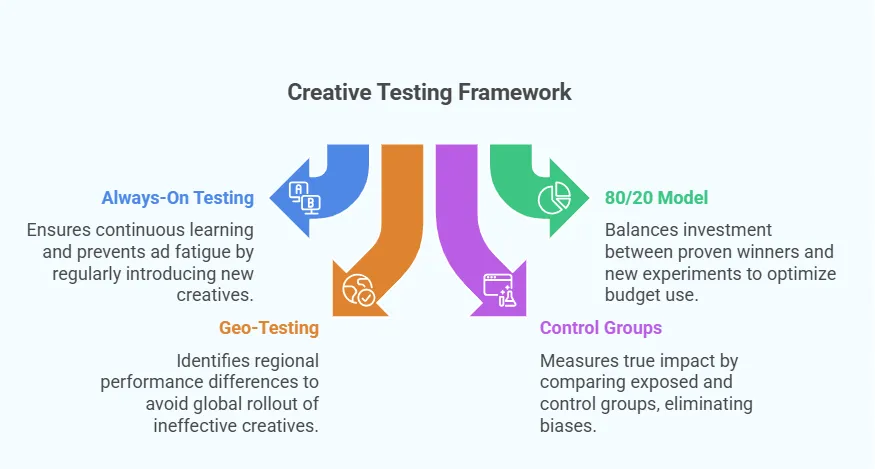
Continuous testing creates a learning loop. Instead of quarterly reviews, you run weekly or bi-weekly cycles where fresh ad variations enter the mix. This approach stops fatigue before it collapses CPA.
For example, a retail brand that rotates two new UGC creatives every week can extend winner performance by months.
Keep 80% of spend behind proven winners and 20% behind experiments. This balance funds scale while still stress-testing new creative concepts.
For instance, a $2M paid social budget could allocate $1.6M to top performers and $400K to testing emerging formats like sequential video ads.
Regional splits let you see whether a creative that wins in one market holds in another. A campaign that cuts CPA by 25% in Europe might underperform in APAC due to different consumer behaviour. Geo-splits make that visible before global rollout.
The cleanest way to measure true lift is by holding back part of your audience. If exposed groups show a 10% stronger brand lift compared to controls, you know the creative has a direct impact on the metric, free from biases like targeting overlap or seasonality.
Each of these frameworks scales because it builds structured, comparable data. The outcome is a creative testing blueprint you can apply globally without wasting budget on false positives.
Scaling creative testing across regions requires more than simply running campaigns in additional markets. You need a system that keeps performance data reliable and comparable worldwide.
Here’s where to focus:
When these practices are embedded, you move from isolated tests to a system that delivers scalable, repeatable growth across every market.
Creative testing at scale means more than running isolated experiments. You should be building a system. When you define clear goals, apply reliable methods, and embed global best practices, your creatives becomes a repeatable growth engine.
Key takeaways
If you’re looking to systemize creative testing and scale performance globally, Fieldtrip can help you out. We connect strategy, creative, media, and measurement into one responsive system, so your ad creatives are tested, optimized, and scaled with precision.
Let’s talk about building your enterprise-grade testing blueprint and turning creative into a repeatable driver of growth.
The best way is to build a structured testing system. Define one clear goal per test, use statistically reliable sample sizes, and run continuous iterations across markets. Standardized reporting keeps outcomes comparable and scalable.
CPA, ROAS, and LTV are core for short-term and long-term efficiency. Brand lift, sentiment, and recall add context on whether creative assets strengthen equity and drive durable growth beyond initial conversions.
Always-on cycles are best. Weekly or bi-weekly testing surfaces early fatigue signals and ensures a steady pipeline of winning creative variations ready to scale across Paid Social and programmatic.
Enterprises often combine multivariate testing platforms, geo-based incrementality frameworks, and unified dashboards. These tools centralize performance data across Paid Social, search, and programmatic for faster, more reliable decisions.
Fieldtrip integrates strategy, creative, media, and measurement in one system. We design test matrices, execute experiments, and deliver performance insights that scale globally with precision and efficiency.
Fieldtrip eliminates silos by running creative and media as one responsive system. This approach ensures ad assets are tested, optimized, and scaled directly against performance outcomes, not vanity metrics.