






















Most predictive lifetime value programs produce a score that nobody acts on. The model runs, every customer record gets a number, and acquisition keeps buying on cost per acquisition because that is what the bidding rules read.
The underlying problem is that the customers who cost least to acquire are usually not the ones worth most over time.
A prediction that could correct this sits unused.
The decision for leaders is whether to let an algorithmic pLTV output steer bids and budgets directly OR to anchor it first inside strategic constraints, a use-specific accuracy standard, and named owners.
The second route pays, because the failures described in the literature are rarely in the mathematics. They sit in the handoff between the model and the decisions it was built to change.
A predictive LTV score is worth its cost only when someone changes a bid, a brief, or a budget because of it. Most models are judged on error rates, which is the wrong test for a marketing organization.
The better test is whether media, creative, and strategy share one definition of a valuable customer, and whether each has a written rule for what the score changes.
That takes clear ownership more than better math: a named owner for each decision, a version of the model finance can rely on, and a version marketing can retrain.
Creative deserves the same evidence. Brief against the customer the model values, then check whether those customers actually arrive.
Predictive LTV fails when the model measures the wrong value, relies on unrepresentative data, or has no route into business decisions.
Predictive customer lifetime value, or pLTV, estimates the revenue or contribution a customer will generate over a defined future period. It uses information available at the scoring date, such as transaction history, subscription activity, and early engagement, to forecast value that has not yet been observed.
A usable prediction needs three labels:
“$200 LTV” is incomplete. “$200 in predicted contribution over twelve months, scored thirty days after acquisition” gives finance and marketing a number they can evaluate and use.
As we flagged in the takeaways, predictive LTV models fail in three ways: their scores go unused, their value definition conflicts with business goals, or their training data no longer represents the customers being acquired.
Each failure connects modeling choices to strategy: the business must specify what value means, which decisions the prediction controls, and when the evidence is strong enough to act.
Predictive LTV scores go unused when no bidding rule, budget process, or creative brief consumes them. The score reaches the warehouse or CRM, but acquisition continues to optimize first-order performance.
That leaves the distinction between acquisition cost and lifetime customer value outside the decision. Assign an owner and write the rule that translates the score into an action.
The cost is more than an unused dashboard. Stellans notes that a simplistic or misapplied model can misallocate spend, miss goals, and leave leaders struggling to defend forecasts under board or investor review.
When a score influences some spend, but nobody owns the rule, the question of how the numbers were built has no clean answer.
Revenue-based LTV can misdirect acquisition spend because revenue does not account for the cost of serving the customer.
Discounts, refunds, product costs, and fulfillment costs can leave a high-revenue customer with low contribution. If the goal is profitable growth, predict customer contribution over the agreed horizon and use that value to set acquisition limits.
Blended LTV creates a separate problem: it hides differences in customer value across acquisition segments. Apply the acquisition rule to each segment’s predicted value, so a low-value segment can’t borrow the average of a high-value one.
The same LTV ratio can produce different CAC ceilings for different segments. Setting different ratios per segment is a strategic choice the business can make, and predictive LTV works either way.
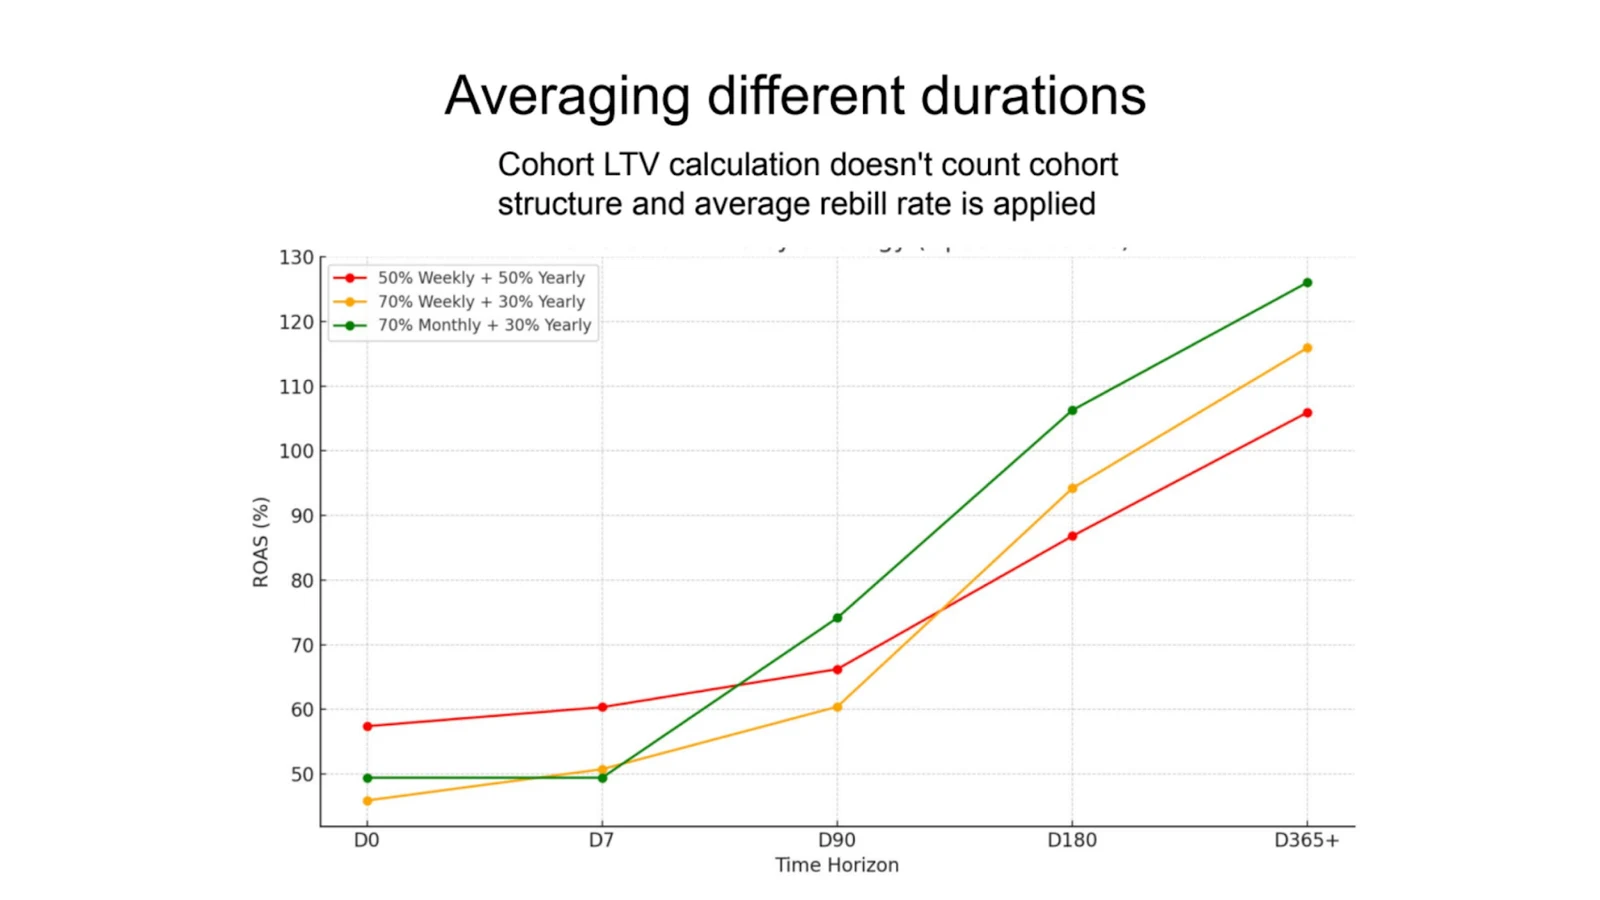
Stale data distorts predictive LTV when the relationship between early behavior and later value changes. Acquisition bias appears when the training data represents a different customer mix from the one the business now wants to reach. A model trained mainly on promotion-driven buyers needs validation before it guides acquisition of full-price customers.
Remember: Check performance by channel, offer, and customer segment before activating predictive LTV-based bidding.
A related friction sits between marketing and finance.
Raphael Tamaki describes what happens when LTV predictions change after finance has used them to forecast quarterly or annual revenue: the accounting team can no longer validate its own numbers. Marketing retrains for responsiveness; finance needs stability.
Both are right. The conflict comes from governance, and a better model won’t resolve it.
Historical LTV measures customer value already observed; predictive LTV estimates value that has not yet been realized. Use historical LTV to assess actual payback and validate predictions. Use predictive LTV when a decision must happen before the customer’s value window is complete. Neither replaces the other: predictions need actual outcomes as their reference.
Historical LTV measures the revenue or contribution customers have generated over a stated observation window. A complete twelve-month cohort figure requires twelve months of outcomes.
It shows whether past acquisition paid back and provides a baseline for future planning. Its usefulness for current bids depends on how closely those historical customers resemble the customers being acquired now.
Predictive LTV estimates customer value before the full observation window has elapsed, using the scoring-date information we described in the definition above. Segment or individual predictions can guide acquisition limits and customer treatment earlier than completed cohorts.
Differences between channel or creative cohorts describe who was acquired. To prove the channel or creative caused the difference, you need a controlled test.
Historical LTV is enough when completed cohorts represent the current business and a predictive model adds no useful advantage to the decision. Use it as the baseline, then test whether early customer signals improve forecasts or acquisition choices.
Repeat purchases and subscriptions can provide those signals, but business model by itself does not prove that predictive LTV is worth building.
| Dimension | Historical cohort LTV | Predictive LTV | Decision it supports | Main risk |
|---|---|---|---|---|
| Latency | Lags by the observation window | Available early in the customer relationship | Historical: channel payback review; predictive: current bids | Historical cohorts may not represent current customers; predictions require validation against later outcomes |
| Granularity | Cohort averages | Segment or individual scores | Historical: annual channel budgets; predictive: audience and creative allocation | Blended averages hide segment differences |
| Objective served | Reports value already earned | Estimates future customer value over a defined horizon | Predictive: value-based bidding | Predicting revenue when margin is the goal |
| Input dependence | Past acquisition mix | Past mix plus early behavioral signal | Either, once representativeness and prediction limits are tested | Both require checks for changes in the acquired customer mix |
| Business model fit | Any model, including one-off purchases | Businesses with predictable future customer value | Choose by predictive signal and decision value | Using predictions without evidence that early signals forecast future value |
Table claims on blending and objective draw on Decile and Finsi; the business-model fit row is editorial judgment.
A conceptual pattern that fits many subscription brands: cohort averages set annual channel budgets, while predictive scores set bids within each channel.
Predictive LTV needs customer-linked transaction history, reliable value records, and early signals that can be tested against later outcomes. The data must connect what was known when a customer was scored with what that customer subsequently generated.
Start with:
Keep information learned after the scoring date out of the model’s inputs. Otherwise, the backtest gives the model knowledge it would not have had in production. The history required depends on the prediction horizon, purchase cycle, and model, so there’s no universal customer count that signals readiness.
A predictive LTV model is accurate enough when it meets the validation standard for the decision it controls. Monetary bidding requires credible value estimates and useful customer ranking. Financial forecasting requires reliable aggregate totals and checks for systematic bias.
Set the prediction horizon, scoring date, aggregation level, and acceptable error before the score influences spend.

We’ll repeat this because it’s the most common mistake: bidding needs both customer ranking and calibrated monetary values when predicted LTV sets the amount the business can spend.
If both segments are substantially overvalued, ranking them in the right order still leaves you overspending on each. Financial forecasting needs accurate aggregate totals and explicit checks for segment bias. Larger samples reduce random noise, but systematic overprediction survives at any sample size.
AppsFlyer describes an internal goal of less than 10% error at day 365 when up to a month’s worth of users is aggregated. That is one vendor’s example, and no industry threshold exists.
What makes it useful is the shape of the rule. As we said above, state the error bound, prediction horizon and aggregation level together, so everyone knows which decision the validation supports.
This is the marketing and finance friction we mentioned earlier. Frequent model updates disrupt financial forecasts when they overwrite the predictions used to build an approved plan.
An update can improve accuracy while making the original forecast harder to reconcile. Preserve the forecast snapshot and assumptions finance used, then release validated updates for operational decisions. Track revisions separately so new evidence does not erase the planning baseline.
| Use of the prediction | Accuracy that matters | Aggregation level | Retraining stance | Who signs off |
|---|---|---|---|---|
| Bidding within a channel | Customer ranking and calibrated monetary values | Segment or individual | Review on triggers; release validated updates | Media lead with measurement |
| Budget allocation across channels | Relative value by channel within a tolerance | Channel cohort | Review on triggers; validate updates against later cohort outcomes | Head of growth |
| Board or investor forecast | Stable aggregate error bound | Monthly cohort or larger | Locked version per reporting period | Finance |
| Segmentation and pricing | Consistent separation between segments | Segment | Periodic re-validation | Strategy lead |
AppsFlyer’s aggregate forecast target applies to AppsFlyer’s own use case. The table is a decision framework, and each team must validate and document its own acceptable error.
Use predictive LTV to set acquisition limits, identify customer patterns for creative briefs, and prioritize segments for strategic investment. Each use needs a written rule and an accountable owner. Media turns value into spending limits, creative tests messages against customer economics, and strategy decides which customer relationships the business wants to grow.
As we explained in the failure section, blended LTV hides segment differences. Predictive LTV fixes this by setting CAC ceilings:
A segment with higher predicted LTV can support a higher acquisition cost, though its budget still needs a ceiling.
A hypothetical example: two channels acquire equal numbers of customers at a $40 CAC. Predicted contribution is $80 per customer in channel A and $200 in channel B. Their blended LTV ratio is 3.5:1, but A delivers 2:1 and B delivers 5:1. At a common 3:1 target, A’s CAC ceiling is $26.67 and B’s is $66.67.
The blended result hides A’s shortfall; segment-level limits reveal it.

Predictive LTV improves creative briefs by showing which products, offers and early behaviors are associated with valuable customers.
There is a loop here that needs a shared cadence.
Creative changes shift the acquired mix, the shifted mix changes the model's inputs, and the model's next output describes customers the last brief produced. Creative and measurement need to review together, or each will keep optimizing against a picture the other has already moved.
Predictive LTV informs strategy by identifying customer segments with different expected economics. Those differences help prioritize retention investment and identify segmentation opportunities.
Use customer research to explain what each segment values, then test pricing, bundles and offers against that evidence.
Pro tip: Fieldtrip’s strategy practice connects consumer segmentation and research with media and communications planning.
Predictive LTV identifies patterns associated with customer value. Why an intervention would change that value is a separate question. Model explanations can show which inputs influence a prediction. Qualitative research, brand tracking and controlled tests help turn those patterns into decisions about positioning, experience and offers.
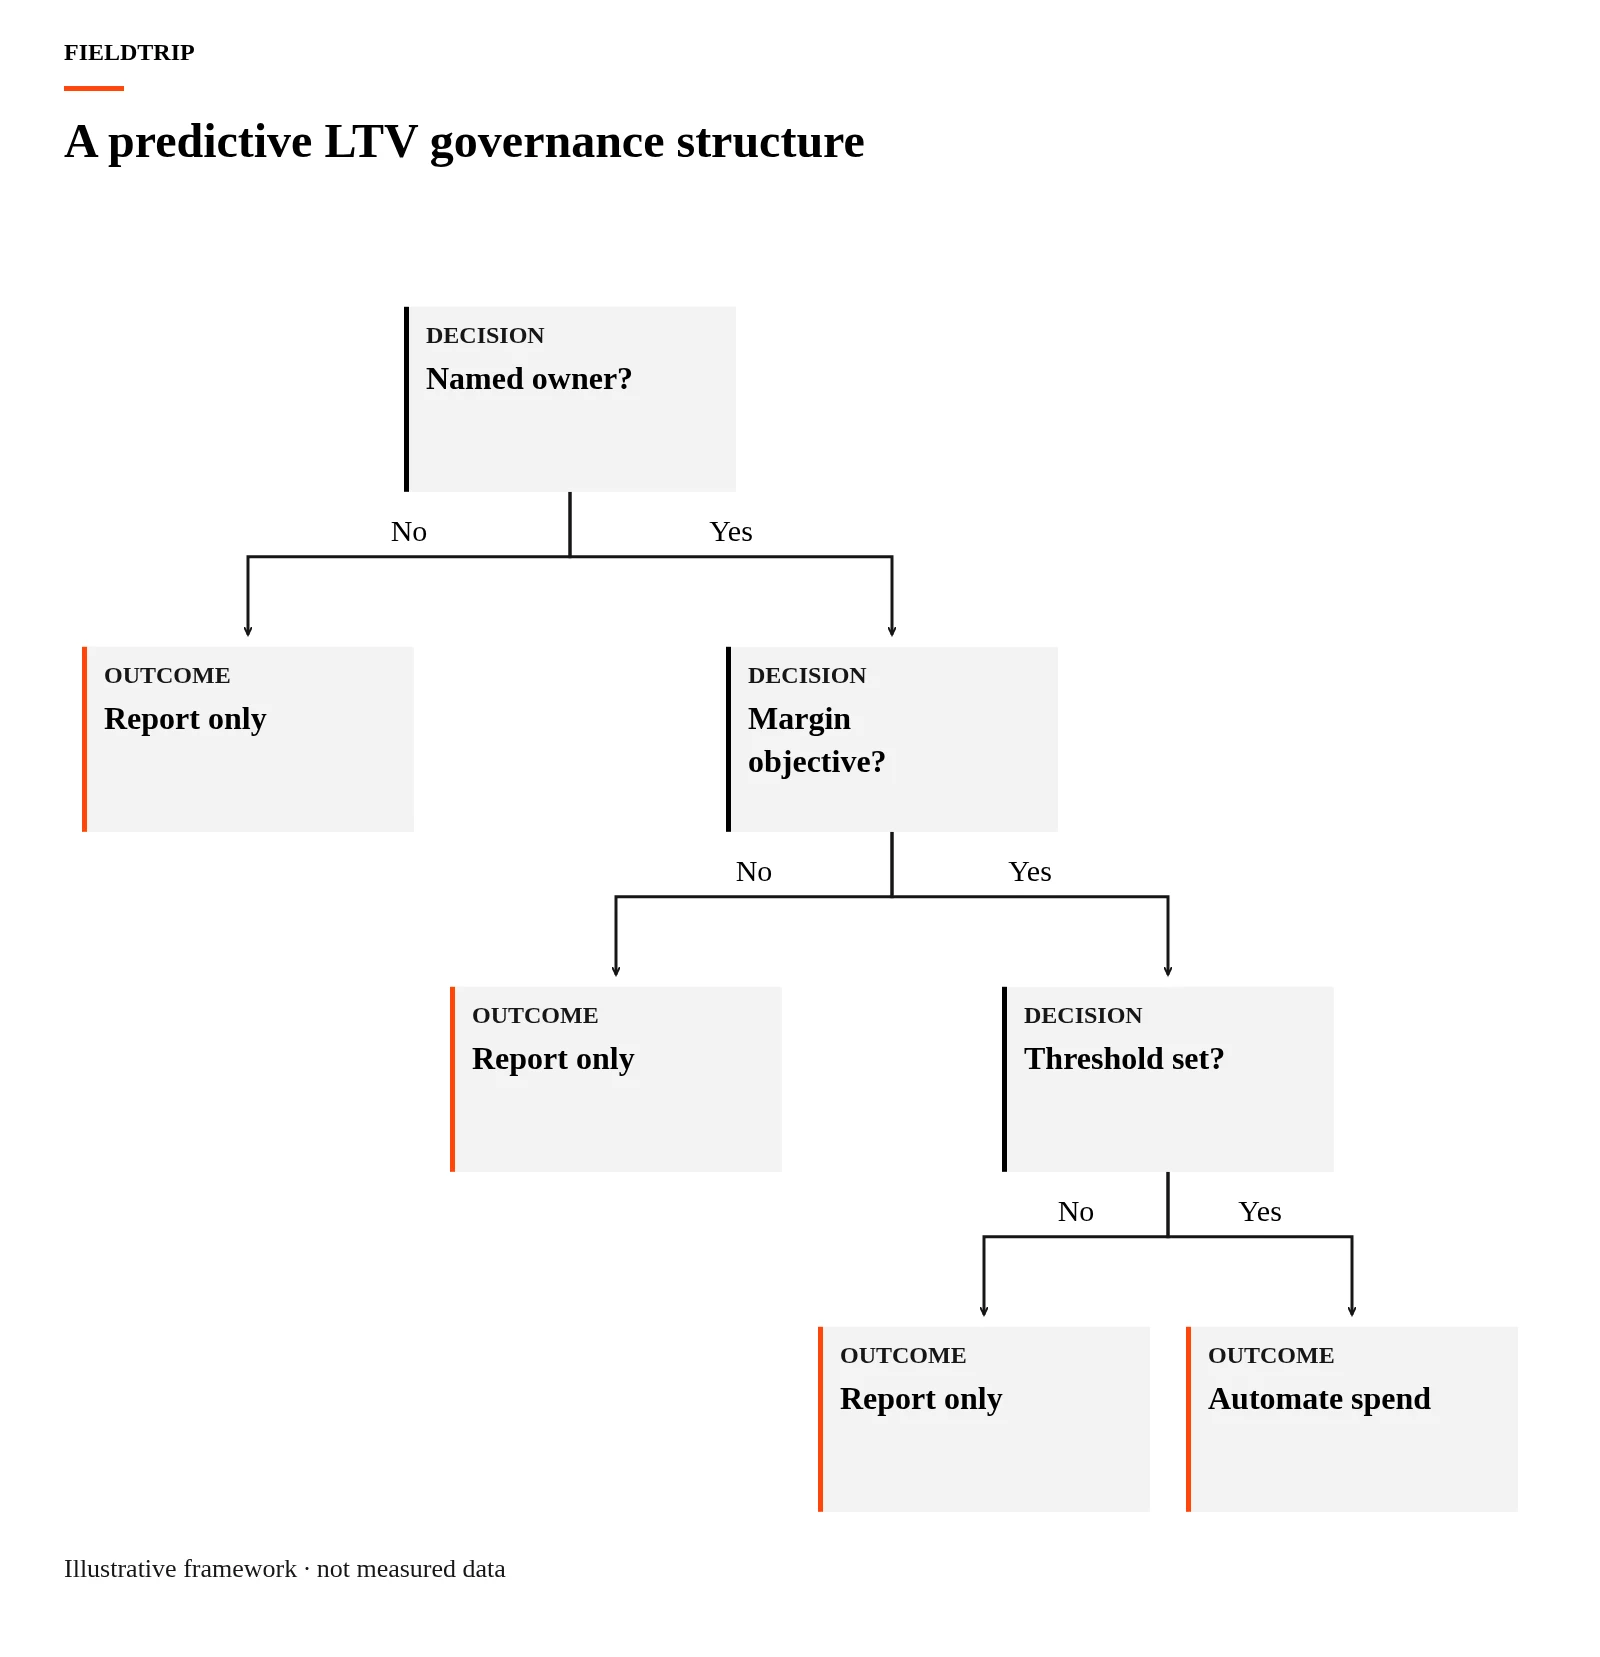
The measurement or data team should own predictive LTV model quality, while the team using the score owns the decision it changes. Finance approves value definitions and financial constraints. Media owns bidding and acquisition limits, creative owns the test plan, and strategy owns segment priorities.
Assign these responsibilities before activating the model, starting with one channel.
We said it above, and it’s worth repeating: one owner for model performance, one owner for each business decision that uses the prediction. In practice, the model owner monitors accuracy, bias, and releases, while the decision owner documents the action rule, spending limits, and results.
Named ownership makes problems actionable, and you still need validation alongside it.
Version LTV forecasts by preserving the model, inputs, and predictions used for each financial plan.
Separate versions preserve accountability without preventing the business from responding to new evidence.
Retrain a predictive LTV model when validation shows that its relationship between early signals and later value has deteriorated.
Changes in pricing, product, onboarding or acquisition mix should trigger a review first; retraining only helps if that review finds the model has drifted.
Combine scheduled checks with event-based reviews, validate the updated model, and release it only when it improves the relevant decision.
Fieldtrip connects growth strategy with creative, media, and measurement so customer economics can inform the work across disciplines. Strategy defines the customer opportunity, creative develops the messages, media manages acquisition, and measurement tests the evidence behind decisions.
For a predictive LTV program, those disciplines need one agreed value definition and clear rules for using the score.
As we recommended in the governance section, start with one channel, one decision owner, and a documented acquisition limit. Compare the resulting customer economics with the existing approach, then expand once the evidence supports it.
If your predictive LTV scores stop at the dashboard, start by reviewing the measurement system behind them.
Check out our measurement practice for performance analytics, creative testing, attribution, and measurement audits.
Use contribution margin when predictive LTV guides profitable acquisition. As we covered earlier, revenue-based LTV does not deduct product, fulfillment, or other variable costs, so it can overvalue customers who generate sales but little contribution. Use revenue predictions for revenue forecasts. If you switch to contribution-based value, agree the included costs with finance and recalculate acquisition limits.
A price change should trigger an LTV model review because it can change conversion, purchase frequency, retention, and contribution. Test whether the existing model remains accurate for post-change customers. Retrain when the evidence shows deterioration and enough relevant outcomes exist to validate an update. Preserve the forecast version finance used for the original plan.
Compare ad creatives on predicted customer contribution relative to acquisition cost, using the same scoring age and prediction horizon. Tag acquisitions by creative and use a controlled test where possible. Average LTV and the share of high-value customers help explain the result, but neither accounts for acquisition cost on its own. Check the predicted advantage against realized contribution as customers mature.
Predictive LTV is useful for one-time purchases only when there is meaningful future value to predict and early information improves the decision. That value might come from service, accessories, or later purchases. If the initial transaction captures nearly all customer value, order contribution and acquisition cost provide a more direct acquisition rule. A lack of repeat purchases does not, by itself, prove that a model will overfit.
Predictive LTV and brand research answer different questions. Predictive LTV estimates customer economics; qualitative research and brand tracking explain needs, perceptions and positioning opportunities. Use high-value segments to focus research, and use research findings to improve offers and messages. The relationship works in both directions: customer research can also improve the model’s inputs and interpretation.