


Share of Search is a metric that’s increasingly appearing in C-Suite reports. After all, Chief Marketing Officers (CMOs) are under pressure to prove that marketing creates future demand. Naturally, they’re keen on metrics that indicate brand health and growth potential relative to competitors.
But the Share of Search can be difficult to interpret. That’s because it has to be seen in the context of paid media, PR, pricing, category demand, and sales.
On top of that, search behavior is changing too. A recent 3Thinkr’s report found 61% of tech CMOs are rethinking marketing to adapt to Artificial Intelligence (AI) led search.
This makes the share of search more useful, but also more complex. When you compare your brand’s visibility across traditional search, AI search, and category level demand, you get a clear answer to one of marketing’s biggest questions: is our brand becoming easier to find, recall, and choose?
In our experience, the best use of share of search is as a strategic signal. It helps you see when brand demand is building before revenue reports fully reflect it.
This guide explains how share of search works, how to measure it, and why CMOs should treat it as a serious indicator of future brand demand.
Share of Search is the percentage of category-level search queries that include your brand compared with the total searches for your brand and its competitors.
It answers a simple question, really. When people actively look for brands in our category, how much of that demand are we capturing?
For example, in a category with four brands, you might compare monthly brand searches for “Brand A,” “Brand B,” “Brand C,” and “Brand D.” If Brand A receives 120,000 branded searches and the category total is 400,000 branded searches, Brand A’s Share of Search is 30%.
Keep in mind that this doesn’t mean Brand A has 30% market share, but it does suggest that Brand A owns 30% of current brand-name search demand in that competitive set.
The metric became widely discussed after Les Binet’s IPA work on Share of Search as a predictive measure. His research argued that branded search can help predict demand and future market share when tracked consistently over time.
This is why we treat it as a directional brand-demand metric.
To calculate Share of Search, define your competitive set, your time period, your regions, and the exact search terms you will track. Then use this formula:
Share of Search = Your branded search volume ÷ Total branded search volume for all tracked brands × 100
For example, say you are measuring four B2B software brands in the U.S. over one month:
Your Share of Search would be: 40,000 ÷ 200,000 × 100 = 20%
That 20% shows your brand captured one-fifth of the branded demand within the defined competitive set. The key phrase is “defined competitive set.” If you add or remove competitors, the number changes.
Therefore, we recommend locking the competitor list before reporting the metric to the board.
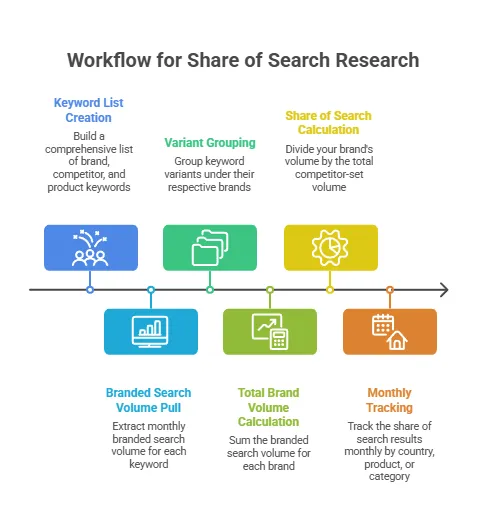
Here’s a reliable workflow to produce Share of Search data:
Pro tip: Don’t mix branded and generic demand in the same calculation. “HubSpot pricing” and “Salesforce demo” are strong branded signals. “Best CRM software” is a category intent. Both are valuable, but they answer different questions. Share of Search should measure brand pull (i.e., mostly focus on branded keywords).
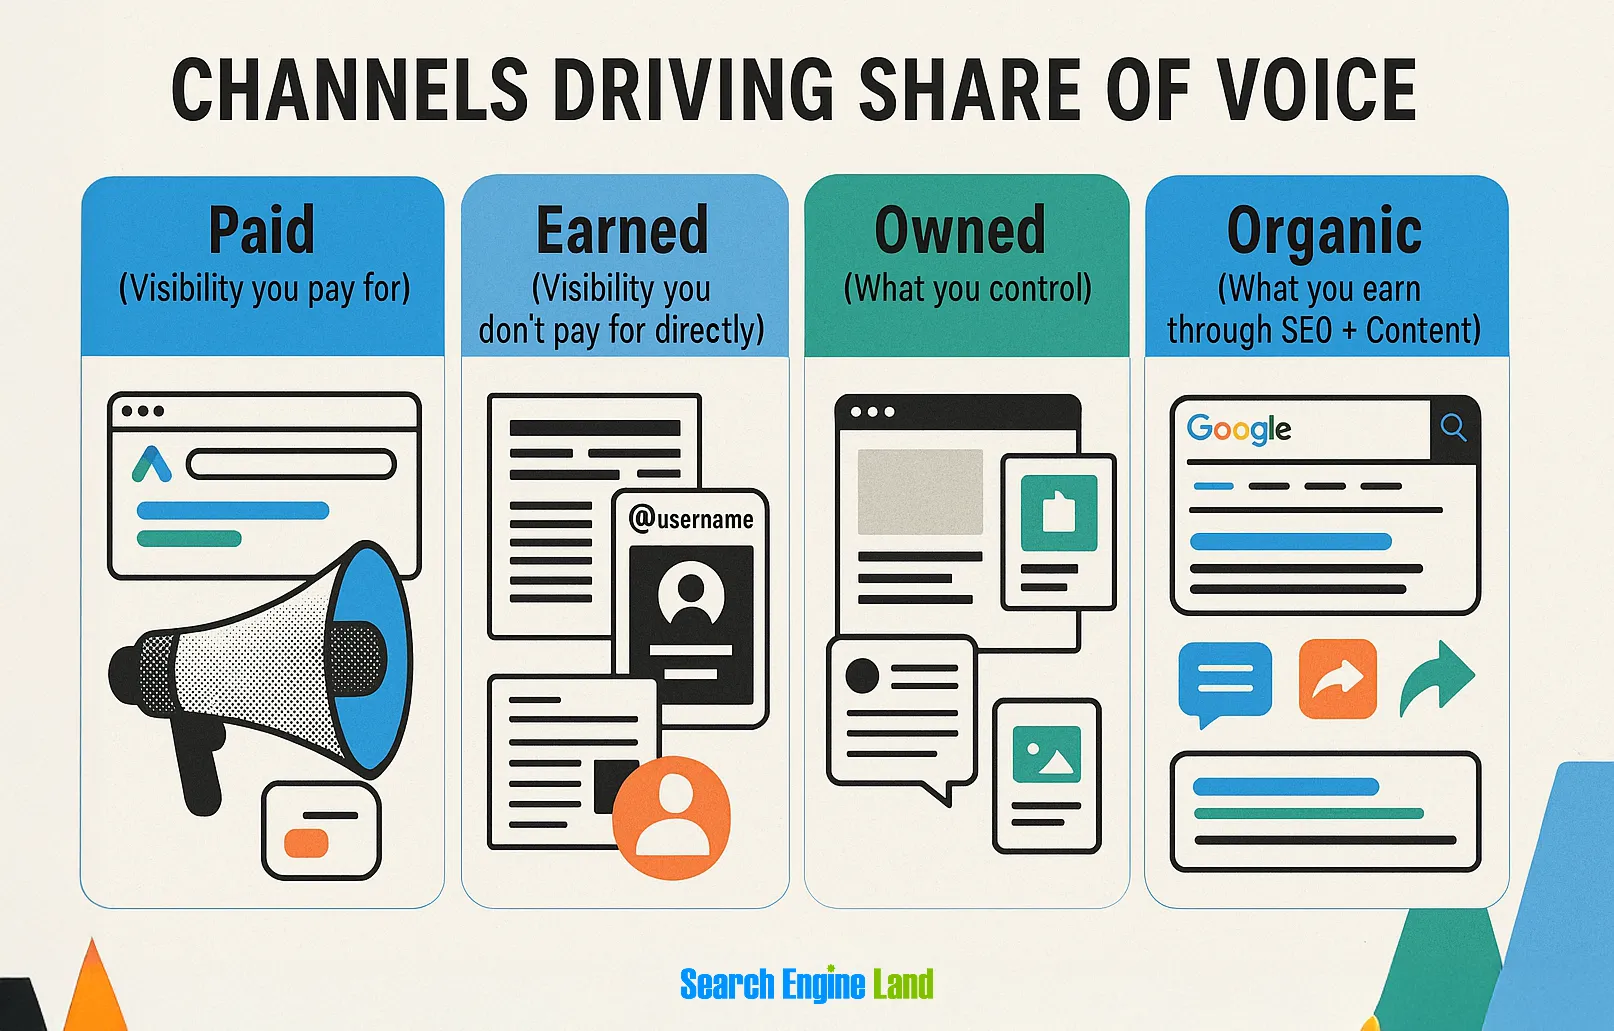
Marketers and CMOs sometimes group Share of Search, Share of Voice, and market share together because all three describe competitive position. But they measure different things at different points in the demand cycle.
The simplest way to think about it is this: Share of Voice measures how loudly you are showing up, Share of Search measures whether people are actively looking for you, and market share measures whether that demand turns into business.
Share of Voice is about exposure. It usually tracks how much of the category conversation, media spend, ad inventory, PR coverage, or search results visibility your brand owns compared with competitors.
For example, if your brand accounts for 25% of total category advertising spend, media impressions, or PR mentions, your Share of Voice is 25%. This can be useful when you are trying to understand whether your paid media, digital public relations, influencer marketing, and SEO campaigns are giving you enough competitive presence.
But Share of Voice has a weakness: it measures what the brand pushes into the market, not necessarily what customers pull from it.
This is where Share of Search becomes valuable. If your Share of Voice increases but your brand searches do not, your campaign may be visible without being memorable. If your Share of Search increases after a campaign, it suggests people are not just seeing the brand but actively seeking it out, which is much more powerful.
Market share is the outcome metric. It tells you how much of the category you actually captured through sales, revenue, customers, units, subscriptions, visits, or another commercial measure.
It’s not the same as Share of Search, but closely linked to it. It’s essentially the signal before the outcome. It shows whether your brand is gaining or losing momentum in demand before sales reports fully reflect the change.
That’s what Les Binet and IPA found in their research on Share of Search. They collected over 10 years of data on brands in three distinct categories (automotive, mobile phones, and energy). The data for some brands (like LG) showed that Share of Search could predict the market share. As the Share of Search dropped, sales dropped too.
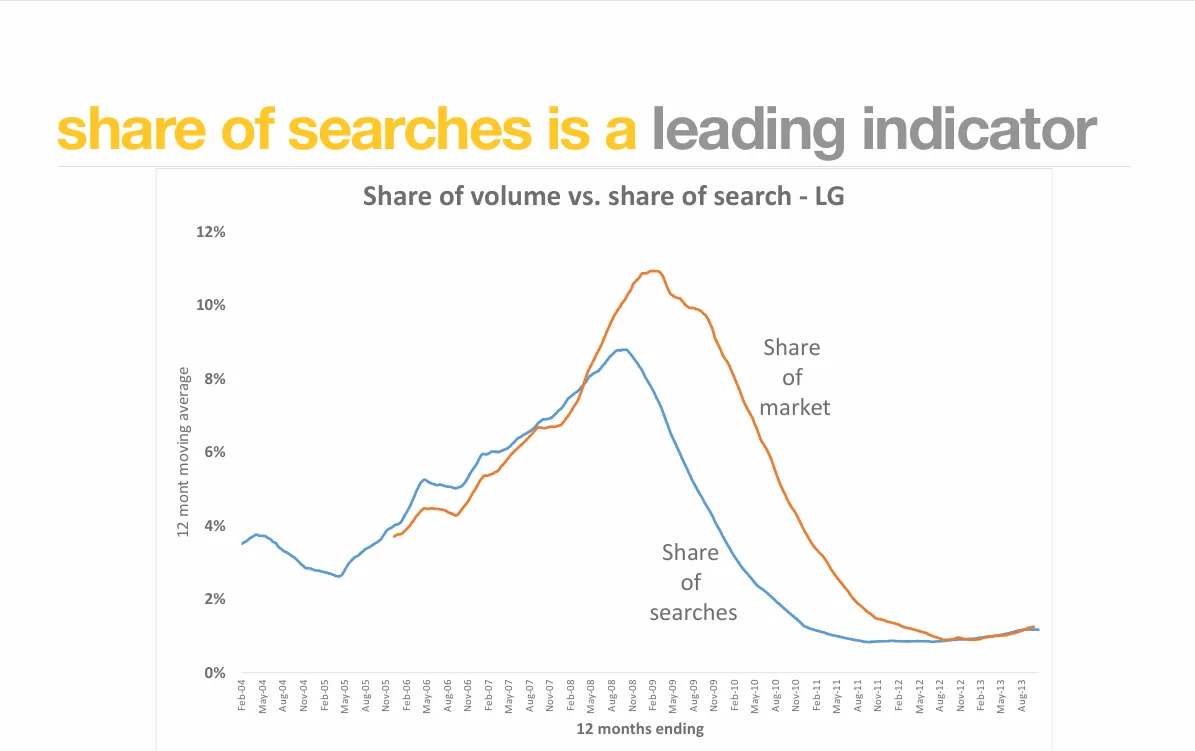
That, of course, is not the principle, but still an important finding connecting these two KPIs.
Market share can be affected by multiple variables like price changes, distribution, sales capacity, product availability, retail placement, promotions, socio-economic conditions, and category growth. Share of Search does not remove those variables, but it can help you detect whether brand demand is moving before the P&L catches up.
CMOs care about Share of Search because it provides a practical way to link brand demand, competitive momentum, and future commercial performance before quarterly revenue reports confirm what has already happened.
It’s not a replacement for a brand tracker or Media Mix Modeling (MMM), but it’s faster, cheaper, and easier to monitor in near real time than many traditional brand health studies.
It’s a unique indicator in that it can broadly confirm the success of what has already happened (marketing, PR, advertising, etc.) and predict what could happen (more competition, category slump, or market share loss).
Liam Moroney, a brand marketer, sums it up nicely:
“Unlike some of the more expensive market research and survey data, a share of search picture is available to every brand, even in the most niche categories when you know how to build it. Because of its strong correlation with the real market share picture, I believe that it can be what market leaders can use to bring a true market level picture to the executive table and to develop more effective strategy.”
So, CMOs and marketers, in general, are getting more interested in this brand metric because of the benefits it offers, which are:
When more people search for your brand by name, it’s usually a sign that your brand is becoming easier to remember, more relevant, or more talked about in the industry.
And brand metrics are commercially meaningful. Nielsen’s experience base found that, on average, a 1-point gain in brand metrics such as awareness and consideration drives a 1% increase in sales.
This is exactly where Share of Search becomes useful for senior teams. For example, a CMO can look at branded search volume in Ahrefs’ Keywords Explorer, compare relative search interest in Google Trends, and then validate the pattern against brand awareness surveys.
Pro tip: Look for sustained growth in branded demand across several reporting periods instead of reacting to a single-week spike.
As we have mentioned, Share of Search is a useful predictor of market share because it can serve as an early signal of market share movements.
Suppose your brand’s Share of Search rises from 14% to 19% over two quarters while sales share remains flat. That’s not proof of future growth, but it gives the CMO a diagnostic question to take to the executive team: Is demand increasing faster than our distribution, pricing, sales capacity, or product experience can convert it?
The opposite pattern is just as important. If your sales share is holding but branded search demand is declining, the business may be harvesting past brand equity while future demand weakens.
The balanced view: Share of Search should verify market share trends, not replace them. It should be used alongside revenue, pipeline, category penetration, and conversion data so you can tell whether the issue is brand demand, sales execution, or market conditions.
One of the biggest advantages of Share of Search is competitor intelligence. It can immediately tell you how your brand is faring online compared to competitors. It prevents CMOs, marketing teams, and the company at large from chasing the wrong competitors.
In many boardrooms, competitor focus is driven by sales anecdotes, founder opinions, or whoever made the most noise at the last trade show. Search behavior gives you a cleaner view of which brands customers are actively considering.
For example, if a challenger brand has only modest revenue today but its branded search demand is growing faster than the category, you know that’s the one to watch.
Share of Search is more valuable after major campaigns because it can show whether the activity created a genuine brand pull. A high-reach campaign may generate impressions, but if branded searches don’t move, the campaign may have achieved visibility without memorability.
This metric can also validate the overall marketing and paid media strategy, at least one that’s chasing actual brand growth. In the long run, if the brand’s search share improves, it’s a clear indication that the marketing spend is working, as far as brand recognition goes.
And it can even be a better alternative to brand equity studies, which fail to link brand recognition to preference.
To get your brand’s Share of Search, you need three things: a defined competitor set, a clean list of branded search keywords, and a consistent source for search volume data.
Commonly, marketers turn to Google Trends, keyword planners, and search volume tools to get the data for Share of Search.
We’ll talk about those in a minute, but first, let’s talk about the keywords, which are super important for this research.
Before calculating anything, study the keywords that actually represent brand demand. This is where many Share of Search reports go wrong.
Share of Search is, for the most part, brand-centric. You should separate brand-name searches from generic category searches, because they answer different strategic questions.
For example:
For Share of Search, the numerator should usually be your brand-name searches, and the denominator should be total brand-name searches across your selected competitors.
However, don’t take it the wrong way. Generic search terms are still valuable, but they belong in a separate research.
You should also classify branded demand by intent. A simple framework works well:
Another easy way to do Share of Search for your brand is through Google Trends. Enter your brand and up to four competitors, select the same country or region, choose a relevant time period, and compare relative search interest over time.
Google Trends lets you compare up to 5 groups of terms at once and up to 25 terms in each group, which is useful if your brand has spelling variations, product-line names, or regional naming differences.
But there’s a caveat. Google Trends does not show exact search volume. Basically, the Trends data is indexed and normalized on a 0-100 scale, where 100 represents peak interest for the selected time and location. More importantly, identical values across different regions don’t necessarily mean identical total search volumes, according to Google.
So, use Google Trends to understand momentum and relative movement.
For example, if your brand’s relative Search interest rises after a product launch while two competitors decline, that is a useful signal. But before you tell the board that demand grew by a specific number of searches, validate the movement with another tool that provides absolute or estimated volume.
The most reliable data for a CMO-ready Share of Search report will come from a search volume tool, where you can get reliable search volume data for selected keywords, in specific markets, and for a defined period.
Marketers typically use SEO and competitive analysis tools like Ahrefs' Keywords.
Tools like Semrush, Similarweb, and Sistrix can also support this workflow when you need SERP visibility, competitor keyword gaps, or a visibility index view across organic rankings.
The following figure describes a practical workflow for Share of Search research:
Share of Search moves when the market has a stronger reason to remember, discuss, compare, or investigate your brand.
That’s where the cumulative effect of your marketing and paid media efforts pays off.
For CMOs, the useful question is not “did searches go up?” but “what caused the change, and is it commercially healthy?”
So, here are the main factors that impact Share of Search:
Paid media is usually one of the clearest drivers of branded search demand. Display ads, paid social, connected TV, sponsorships, and high-reach campaigns can all make your brand easier to recall.
If your advertising spend, sponsorships, category entry-point messaging, and distinctive assets make the brand easier to recall, branded search volume should ideally rise over time.
Campaign timing also matters. A product launch, Super Bowl ad, analyst report, founder interview, or strong influencer marketing push can create a temporary spike in branded demand.
Your Share of Search report should be able to separate those short-lived bursts of popularity and demand. At Fieldtrip, we usually compare campaign dates against Google Trends data, branded organic sessions, direct traffic, and paid search brand impressions.
Search visibility (organic and paid) can also influence the metric when buyers repeatedly encounter your brand across search results, reviews, comparison pages, analyst roundups, and category content.
This is where surround-sound SEO becomes relevant (we’ll cover it in more detail in the next section).
If you’re specifically trying to take more search share in the market, you have to invest heavily in search marketing. That’s important for brand visibility, but also for non-branded visibility, which is all the more important for reputation building.
AI search adds another layer. Pew Research Center found that, in a March 2025 analysis, users who encountered a Google AI summary clicked a traditional result in 8% of visits, compared with 15% when no AI summary appeared.
AI citations and clicks don’t directly measure Share of Search, but they show why CMOs need to watch how AI-shaped SERPs affect discovery, clicks, and brand recall.
PR can move Share of Search in either direction. Positive coverage, awards, funding announcements, and customer wins can increase high-quality branded searches. But negative press, outages, lawsuits, recalls, layoffs, or social backlash can also create search spikes.
That’s why we always segment branded queries by intent. Searches like “[brand] pricing,” “[brand] demo,” and “[brand] reviews” are healthier signals than “[brand] scandal” or “[brand] outage.”
Share of Search should be interpreted alongside sentiment, conversion rate, and organic search traffic.
Category dynamics also play a role. If the entire category grows, your brand searches may rise even while your Share of Search falls. For example, a cybersecurity vendor might see more branded demand after a high-profile breach increases board-level urgency across the industry.
But if competitors gain branded searches faster, your relative share declines. We recommend tracking both absolute branded search volume and relative Share of Search in the same dashboard.
Improving the share of search takes more than one campaign or one channel. It depends on how well your search, paid media, social, PR, content, and demand generation efforts work together.
In simpler terms: make your brand easier to remember, easier to find, and more likely to be searched when buyers compare options in your category. That’s not an easy feat, but not impossible either.
The following five recommendations will help you tread in the right direction and gain more Share of Search and possible market share, too.
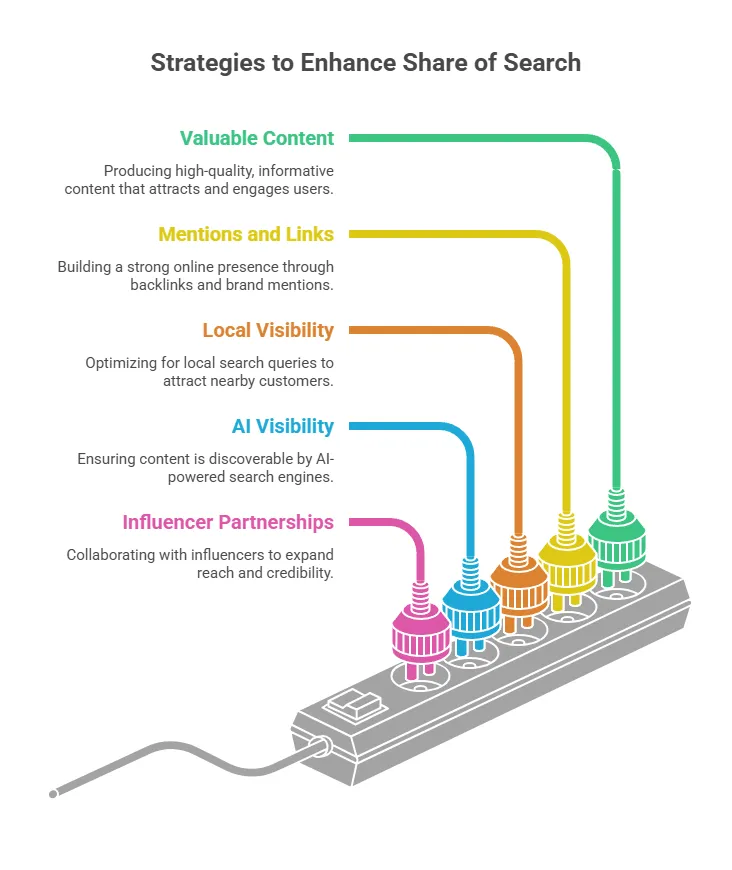
Valuable content improves Share of Search by making your brand the answer buyers remember before they open a search engine. This means your content should rank for organic keywords and attach your brand to category problems, buying triggers, and executive-level questions.
Google’s Search Central guidance says its ranking systems are designed to prioritize helpful, reliable, people-first content, not content created mainly to manipulate rankings.
Google also advises using the words people would use to find your content and placing them in prominent locations, such as titles, headings, alt text, and link text.
Buyers may not necessarily buy from your brand even if it shows at the top. Many do their research on third-party websites, review sites, blogs, and forums.
That is the idea behind surround sound SEO: show up wherever buyers research the category, not only on your own domain.
But how will that improve brand search? Well, branded demand typically grows after repeated third-party exposure. If the audience repeatedly sees your brand mentioned in trusted sources for a category, the next time they need that thing, they might just search specifically for your brand.
This is where you want to invest in digital PR, affiliate marketing, and link building, in addition to traditional SEO.
For multi-location brands, franchises, healthcare groups, restaurants, home services, financial services, and retail chains, local SEO can directly influence Share of Search. When people repeatedly see a brand in maps, local packs, reviews, and “near me” results, brand familiarity compounds.
Google says local results are based mainly on relevance, distance, and prominence. It also recommends completing detailed business information in Google Business Profile so Google can better understand and match the business to relevant searches.
AI search is here, and it’s getting bigger and bigger. And it’s another lever for gaining search share by consistently being cited in AI overviews and chatbot answers. With repeated exposure, the person searching won’t just become familiar with the brand but will begin to trust it as well. That, in turn, can translate into more branded searches.
Ahrefs’ 2026 research on AI Overviews reported that brand mentions were the number-one correlating factor with AI Overview visibility. Similarly, its research on “best” lists found a correlation between strong placement in third-party lists and a higher likelihood of appearing in AI responses.
Your team should test category prompts in Google AI Overviews, ChatGPT, Perplexity, Gemini, and Bing Copilot; document whether your brand appears; and identify the sources those systems cite.
Again, this is where expert content, third-party mentions, and reviews can support AI search visibility. To fast-track this effort, you can partner with GEO agencies.
Influencer partnerships and PR efforts can increase Share of Search when they create a recall strong enough to make people search for the brand later. This is all the more useful for categories where buyers trust practitioners, creators, analysts, consultants, or niche communities more than brand advertising.
Nielsen found that influencer marketing had 79% aided recall and 62% unaided recall. And it also reported that an average of 80% of influencer ad viewers were able to recall seeing the featured brand across nearly 200 measured campaigns.
Nielsen further found that influencer ads drove a 9-point increase in both brand affinity and purchase intent versus people who did not see the ads.
Creator-led marketing is great for both awareness and conversions. That’s why we see influencer marketing as an overall brand growth lever. We’ve helped brands like 7-Eleven, Marvel, and Nordstrom ride the creator wave to more brand recognition, particularly among younger audiences.
Similarly, PR coverage around new launches or events can also create more brand awareness and recall, which later improves the Share of Search online.
Share of Search should inform marketing strategy by helping you decide where to invest, which competitors to watch, and whether your brand-building efforts are creating real demand.
It gives CMOs a directional signal between campaign activity and commercial outcomes.
You can use share of search to guide marketing and media buying strategy in these ways:
The first strategic use is budget allocation. If your branded search demand is rising after a campaign, but conversion is flat, the problem may not be awareness; it may be pricing, landing pages, sales follow-up, product-market fit, or channel coverage.
If your branded search demand is falling while competitors gain, it may be time to rebalance budget toward brand advertising, PR, creator partnerships, and category education.
The second use is competitive diagnosis. Track your Share of Search by brand, product line, and region, then compare it with Share of Voice, organic search traffic, paid search impressions, pipeline, and revenue.
If a competitor’s branded search volume rises before their sales share does, they may be building future demand. If they dominate SERPs for comparison and review queries, they may also be intercepting high-intent buyers before those buyers search for your brand.
This is where an SEO agency or internal SEO professionals can help you connect branded search trends with ranking data, content gaps, paid search campaigns, and third-party visibility.
The third use is forecasting. As we explored, it’s a good indicator of where the market is heading, but not a hundred percent correct. So, the best move is to feed Share of Search into your predictive models alongside media spend, Share of Voice, brand tracker data, pricing, distribution, pipeline, and category demand.
The metric becomes more powerful when you measure the gap between demand creation and demand capture.
Pro tip: While Google gets the lion’s share of the traffic, you should also get Share of Search for other search engines like Bing and Yahoo. If you operate in China or Russia, your strategy should account for local search engines and search behaviors.
Share of search gives CMOs a practical takeaway: when more people in the market are searching for your brand, your future demand position is likely getting stronger.
SEO and paid search can influence that movement, but share of search reflects more than search activity alone. It is shaped by your whole marketing system, including media, PR, creator partnerships, category education, creative quality, and brand recall.
If you’re new to the market or operate in a heavily contested niche, improving Share of Search, and by extension, market share, takes a strategic combination of campaigns, PR, influencer collabs, and SEO/GEO.
This is where a full-service marketing agency like Fieldtrip can make a big difference and take the brand in the right direction.
If you want to combine strategy, media, creative, and analytics as a mission to be the market leader, get in touch with our experts.
An example of share of search compares branded search volume between competitors. If Brand A receives 50,000 monthly branded searches and the total branded searches across five competitors equal 200,000, Brand A's share of search is 25%. Marketers use this metric to estimate brand awareness and market momentum.
The Share of Search formula is:
Share of Search = (Brand Search Volume ÷ Total Category Search Volume) × 100.
Large brands operating in competitive markets should know their Share of Search. Consumer brands, e-commerce businesses, SaaS companies, automotive brands, and retailers benefit from tracking this metric because it reveals changes in brand interest before sales data becomes available
Fix anomalies in share of search data by identifying one-time events, removing irrelevant branded queries, standardizing keyword lists, and reviewing seasonality trends. Product launches, viral campaigns, or news coverage can temporarily distort branded search volumes and require contextual analysis.
Yes, Fieldtrip can help your brand gain more Share of Search through increased brand visibility, better content performance, and strong paid media. As a full-service marketing agency, our dedicated teams across advertising, SEO, digital PR, and measurement can orchestrate marketing efforts that help grow the brand and its demand.
Popular tools for determining Share of Search include Google Trends, Semrush, Ahrefs, Glimpse, and Brandwatch. These platforms track branded search demand, monitor competitor trends, and help marketers calculate Share of Search using search volume data.