

























Marketing budgets have barely moved. Gartner puts marketing spend at 7.7% of company revenue in 2025 and 7.8% in 2026, while 56% of CMOs say their budgets are insufficient to execute their plans. This makes every increase in one paid channel a trade-off somewhere else.
Resource allocation has become a core strategic decision.
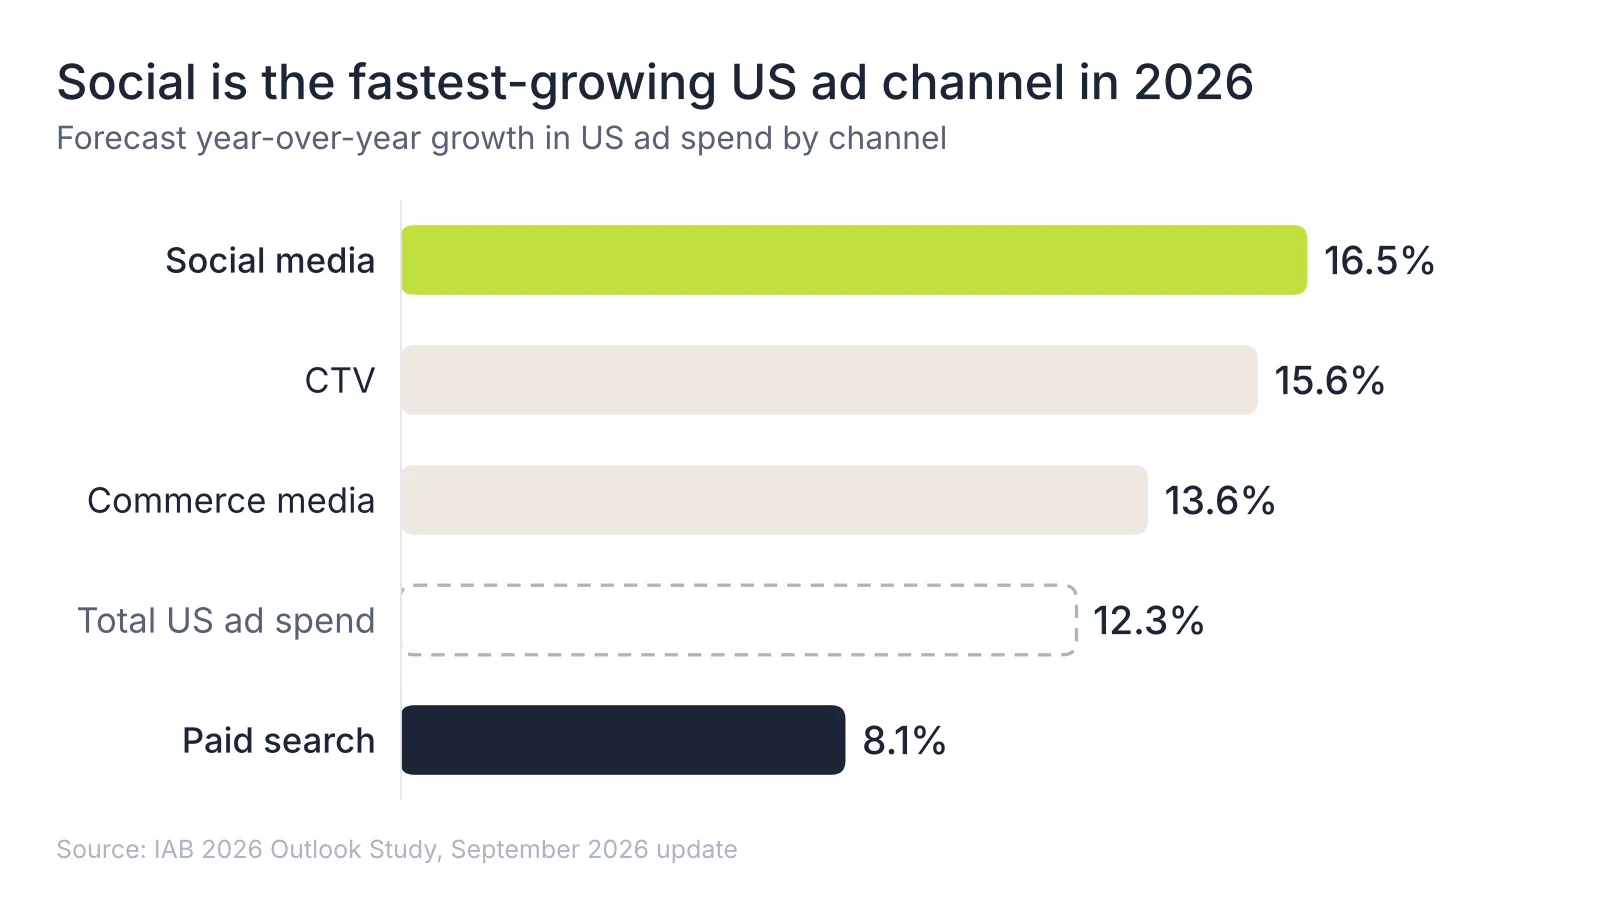
Ad buyers are already shifting spend. IAB's buyer survey forecasts US social ad spend growing 16.5% in 2026 against 8.1% for paid search.
What most teams lack is a rule for when a shift between media channels is justified in their own account, and when it's just following the market.
This guide covers the signals that justify moving spend from search to social, how much to move, how to test it, and what to track afterward.
P.S. If you'd rather have a team plan and test the shift with you, our media team at Fieldtrip runs cross-channel reallocations as structured experiments.
We treat every reallocation as an experiment. Media buying is where a hypothesis about your channel mix meets real numbers, and a budget shift with no holdout produces spend without a lesson. CAC and MER are the scoreboard, because platform dashboards each grade their own work.
And on social, the creative does most of the targeting now, so headroom there is bought with new concepts. A plan that moves money to social without a plan for the ads it will run is half a decision. The rest of this article is built on those three ideas.
Media budget allocation is how you divide paid media spend across channels, campaigns, and funnel stages, and how often you revise that split. It sits inside marketing budget planning, below the business goals and marketing goals that set the total.
Two terms get mixed up here:
The rule this article argues for is simple. Put the next dollar where it buys the cheapest additional customer, then check again on a fixed cadence. This makes media budget optimization a recurring decision, informed by your own response data.
This article focuses on paid search and paid social. Organic channels like SEO and content marketing follow different economics and are out of scope here.
Fixed allocation rules can help teams spread risk, protect experimentation, or balance brand and activation. They cannot tell you when a specific channel in your account has stopped delivering efficient returns.
Neither one is a reallocation trigger.
The 70/20/10 rule assigns 70% of spend to proven channels, 20% to promising opportunities, and 10% to experiments. It is useful for protecting testing budget.
The 60/40 rule, based on Les Binet and Peter Field’s IPA research, suggests allocating roughly 60% of spend to long-term brand building and 40% to short-term activation.
Even the 60/40 rule moves with context. The Binet and Field averages reported by Marketing Week run 62/38 for B2C, 46/54 for B2B, and 80/20 for financial services.
The appropriate mix depends on the business model, category, and buying cycle.
Brands that model their own data mostly find a different answer again. Polish e-commerce company Allegro had been working from an 80/20 performance-to-brand split. Its Google Meridian model indicated an optimum closer to 60/40, and reallocating spend at the same overall budget produced double-digit revenue growth.
The takeaway is simple: fixed ratios are planning frameworks. Reallocation decisions need account-level evidence showing where the next dollar is likely to produce the strongest incremental return.
| Rule | What it answers | What it can't tell you | Signal that replaces it |
|---|---|---|---|
| 70-20-10 | How much to protect for testing | Whether your "proven" 70% is saturated | Marginal CPA by spend band |
| 60/40 brand/activation | How to balance long and short-term marketing strategies | Which channel should carry each share | Incremental lift by channel |
| % of revenue benchmarks | How big the total budget should be | Where the next dollar goes | Incremental CAC against a holdout |
| Last year's split | What worked before | Whether auctions, costs, or audiences changed | Trend in CPC, impression share, and frequency |
Paid search captures intent that already exists, so its ceiling is set by query volume. Paid social can stimulate demand beyond existing search volume, so its ceiling is set by audience size and how many fresh ads you can feed it.
This difference shapes your whole marketing channel mix. Pay-per-click advertising on Google Ads can only buy the searches people make. Once valuable search demand is largely covered, additional spend can produce progressively more expensive conversions.
Social media advertising on Meta Ads, TikTok, or LinkedIn Ads works the other way: spend can grow for a long time, but frequency climbs and results fade if the creative doesn't change.
The key difference is where each channel hits diminishing returns and how those limits show up in the account.
| Attribute | Paid search | Paid social |
|---|---|---|
| Role in marketing funnels | Captures demand at the bottom of the funnel | Creates demand at the top and middle, converts some directly |
| What caps scale | Number of relevant searches | Audience size and creative supply |
| How saturation shows up | Rising CPC, impression share already near 100% | Rising frequency, rising CPM, falling click-through |
| Attribution bias | Last-click reporting tends to over-credit it | Short click windows tend to under-credit it |
| Time to read a test | Days to a few weeks | Several weeks, because effects lag |
| Fit for lead generation | Strong for high-intent queries | Strong for volume, needs lead-quality checks |
Reallocation can also move in the opposite direction. Some accounts should shift budget from social back to search when high-intent demand is being underfunded. The last sections of this guide cover when it can happen.
Move budget when search shows saturation and paid social shows measured headroom at the same time. One without the other is a reason to investigate. Signals 1 to 6 describe search running out of room; signal 7 confirms social has room to take the money.
| Signal | Where to read it | Threshold that starts a test |
|---|---|---|
| 1. Top search spend band costs above target | Weekly spend and conversions by band | Cost per added conversion above target for 4+ weeks |
| 2. No unbought search inventory | Google Ads impression share columns | Impression share lost to budget near zero for 4+ weeks |
| 3. Non-brand CPC inflation | CPC and impressions, quarter over quarter | CPC rising with flat impressions and flat conversion rates |
| 4. Low branded search lift | Brand-term holdout test | Little or no lift in a low-competition category |
| 5. Incremental CAC creep | Holdout-based CAC, monthly | Up two consecutive months beyond seasonal baseline |
| 6. Shrinking click supply | Clicks and CTR on informational queries | Clicks falling while impressions hold |
| 7. Social headroom | Frequency, CPM, lift tests | Stable CPM as spend rises and positive measured lift |
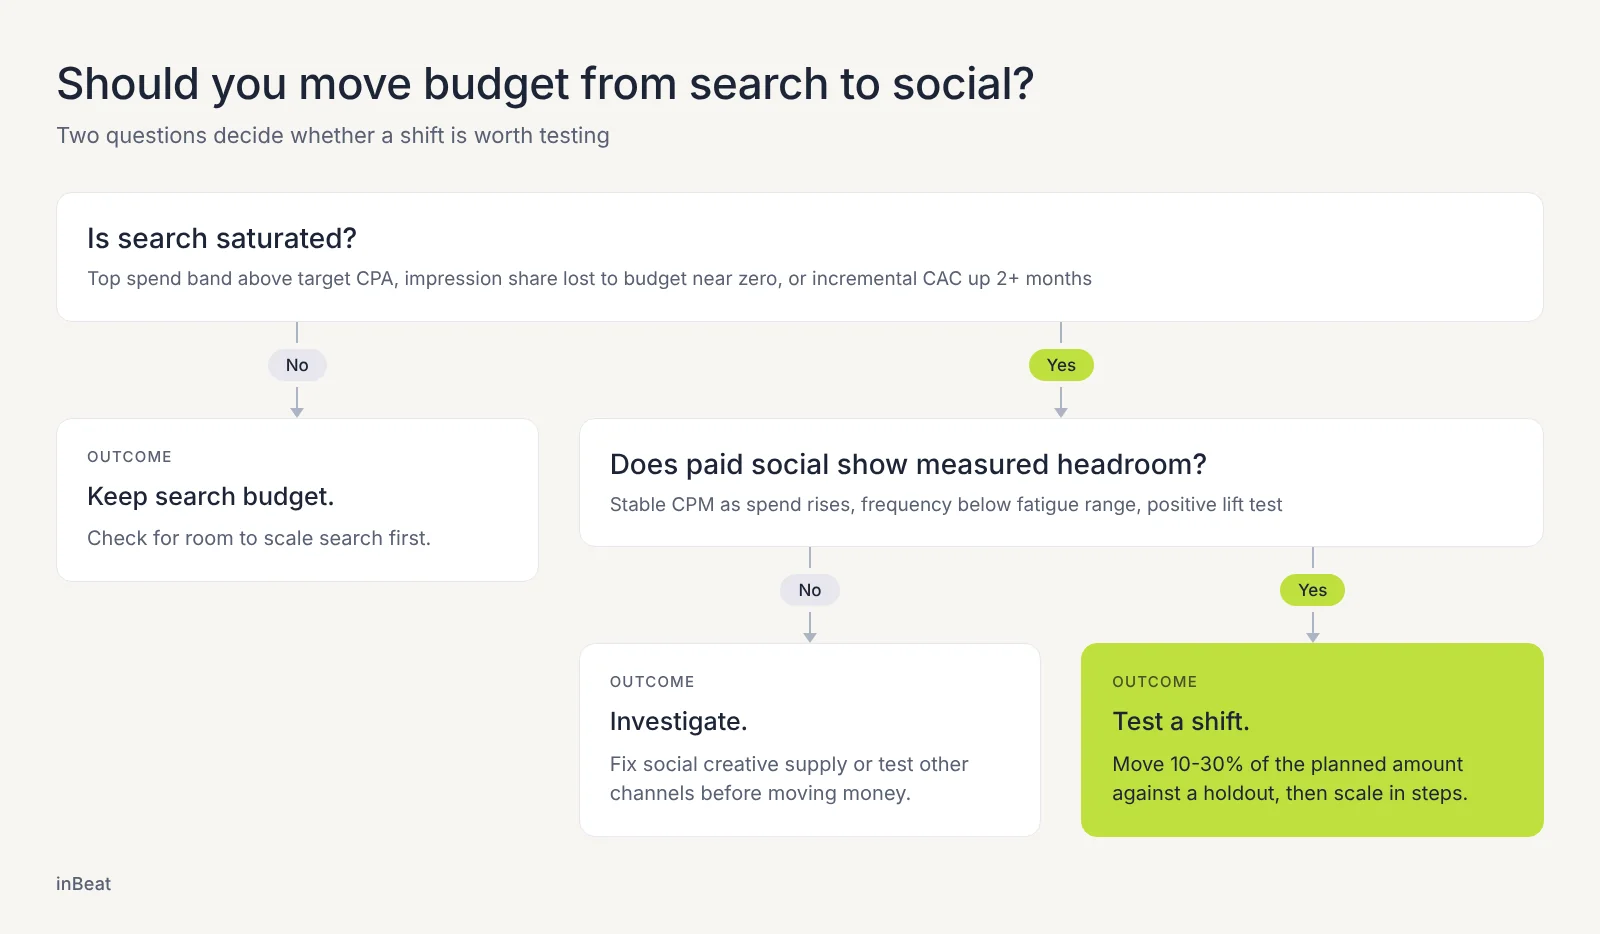
Your top spend band is the clearest saturation signal. Blended search efficiency can hold steady while the last slice of conversions costs two or three times as much. Look at the weeks you spent the most and compare what those extra dollars bought.
Start a test when the cost of those added conversions sits above your target CPA, or your LTV-based ceiling, for four weeks or more. The next section shows how to calculate it.
If Search lost IS (budget) is near zero, additional budget alone is unlikely to unlock much more eligible inventory.
Check Search lost IS (rank) alongside it. If lost to rank remains high while lost to budget stays near zero, competitiveness is the constraint, not budget. If both remain low for four weeks or more, search may be approaching its available ceiling.
Rising CPCs on flat query volume mean you're paying more for the same searches. Google's own filings show the change is gradual:
Alphabet reported Search cost-per-click up 3% and paid clicks up 13% year over year in Q2 2026. Alphabet’s aggregate numbers show that broad market movements can differ sharply from what happens inside an individual account. Your account’s non-brand trend is the number to watch.
Start a test when non-brand CPC rises quarter over quarter while impressions and conversion rates stay flat. Auction inflation alone doesn't prove saturation. It does mean the price of search has changed, so it's time to compare its marginal cost with other channels.
Branded search mostly gets credit for customers who would have arrived anyway. eBay's field experiments, published in Econometrica, found brand-keyword ads had no measurable short-term benefit and that paid search returns were "a fraction of conventional non-experimental estimates."
Newer research shows the answer depends on competition. In brand-keyword experiments on Bing, Simonov, Nosko, and Rao found that when no competitors were in the auction, a brand's own ads lifted its clicks by only 1%-4%. If a brand-term holdout shows little lift and few competitors bid on your name, that budget can fund a social test.
Competitive categories are a different case, covered under mistakes below.
Incremental CAC rising for two consecutive months, beyond your normal seasonal pattern, is a durable signal. One bad month is noise.
Two months, after you've ruled out tracking breaks and creative fatigue, usually means you're buying fewer net-new customers per dollar.
You're not alone in feeling this. IAB's commentary on its buyer survey notes that brands are "rebalancing their growth strategies as acquisition costs rise." The incremental CAC section below covers how to calculate incremental CAC and separate real creep from false alarms.
AI Overviews reduce how many people click any result, which caps what search budget can buy on informational queries and the web traffic it sends. Pew Research found users clicked a traditional result on 8% of visits when an AI summary appeared and 15% when none did.
The effect on paid clicks is less settled. Treat falling clicks on the informational PPC ads you bid on as a signal, keep commercial-intent terms, and re-check this quarterly, because it's still shifting.
Social has headroom when frequency stays below your fatigue range, CPM holds steady as spend rises, and a lift test shows positive incremental results. Together, these signals suggest the channel can absorb more budget without immediate efficiency loss.
Low CPM alone is not enough. Cheap impressions with no incremental lift do not justify moving more spend into the channel.
Watch frequency and CPM closely as you scale. Rising frequency, higher CPM, and weaker response can indicate that the audience or creative supply is starting to saturate.
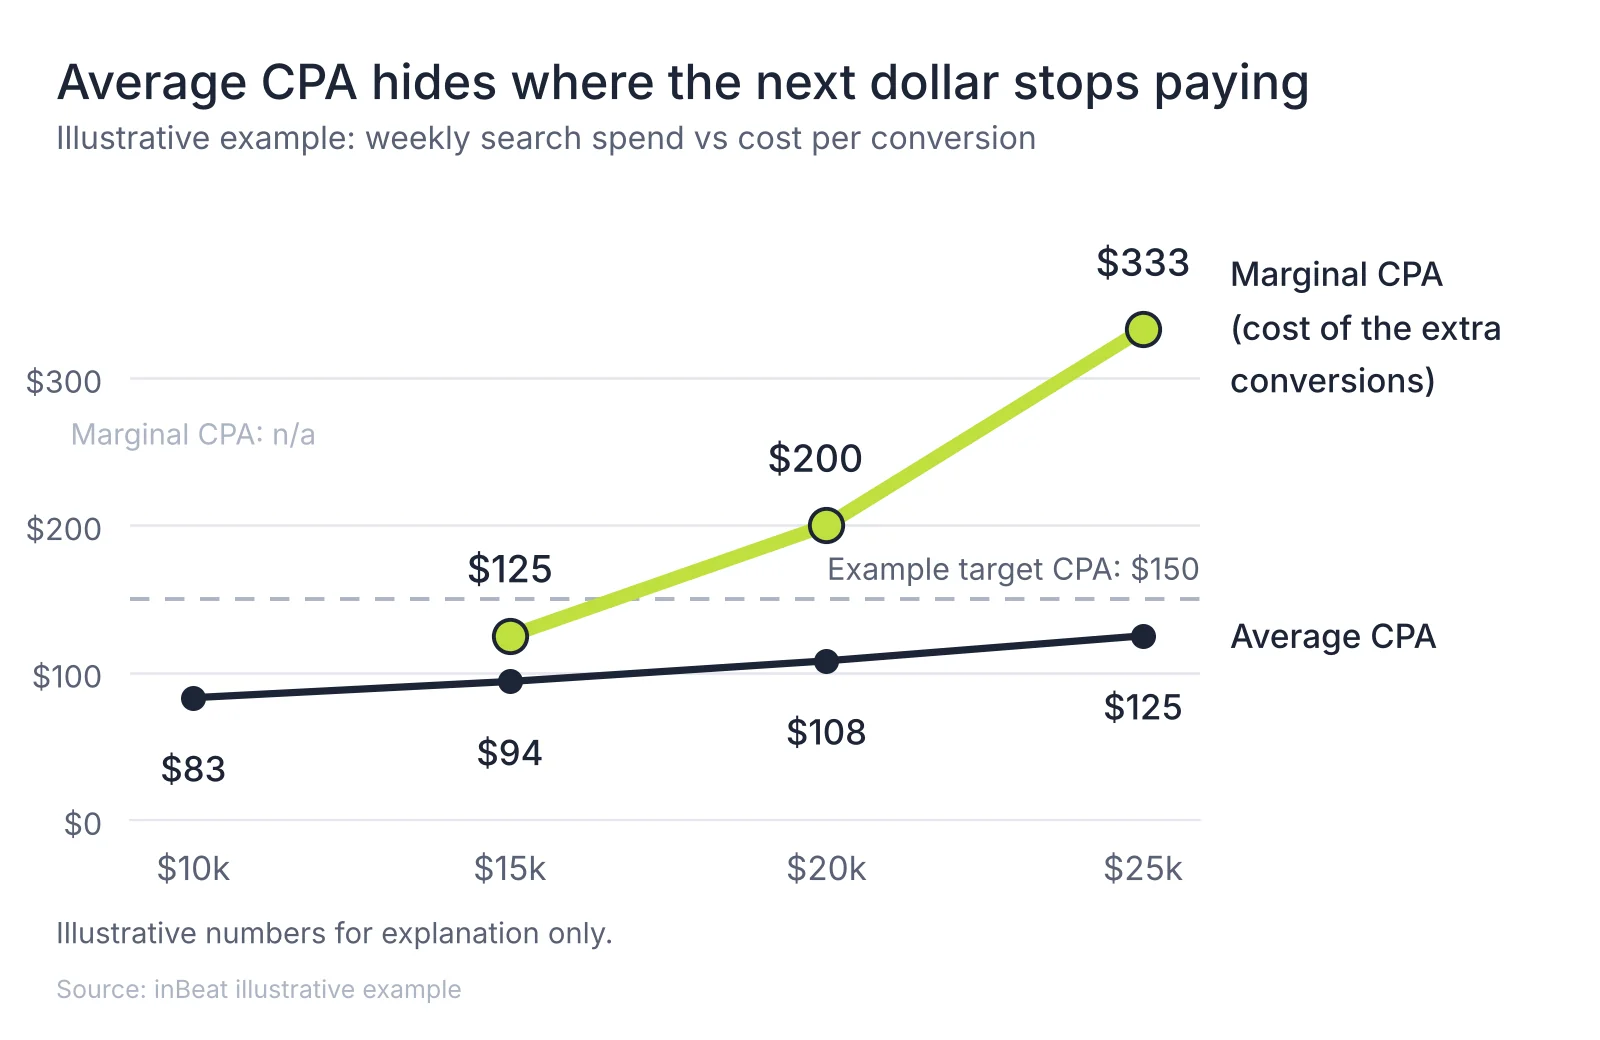
The point of diminishing returns is where marginal CPA crosses your target, even if average CPA still looks fine. A saturation curve plots conversions against spend, and its slope tells you what the next dollar buys.
Average CPA is total cost divided by total conversions. And marginal CPA is the extra cost divided by the extra conversions it bought. Google's own Ads glossary defines marginal CPA as "cost divided by increase in conversions."
Because response or saturation curves flatten as spend grows, marginal CPA almost always sits above average CPA.
Here's how that plays out in a simple, illustrative example:
| Weekly search spend | Conversions | Average CPA | Marginal CPA |
|---|---|---|---|
| $10,000 | 120 | $83 | n/a |
| $15,000 | 160 | $94 | $125 |
| $20,000 | 185 | $108 | $200 |
| $25,000 | 200 | $125 | $333 |
Illustrative numbers for explanation only.
At $25,000 a week, average CPA is $125, which might look acceptable. The last $5,000 bought 15 conversions at $333 each. If social can deliver an incremental customer for $150, that $5,000 belongs there.
Both of the major open-source marketing mix modelling tools build diminishing returns in directly.
Google Meridian models saturation with a Hill function and adstock curves for carryover. Meta's Robyn does the same, stating plainly that "the more I spent on a channel, the less marginal return I will get."
Meridian's documentation also gives a direct reallocation rule: channels with high ROI but low marginal ROI "are likely in the saturation phase," and budget can move to channels still well below saturation. One caution from the same docs: curves are less reliable outside the spend ranges your campaign data actually covers.
Our guide to media mix modeling for enterprise marketers covers how larger teams build and present these models.
You can approximate a curve from your own performance data in an afternoon:
Pro tip: Use new-customer conversions where you can. A curve built on all conversions, including repeat buyers, will make search look less saturated than it is.
Measure incremental CAC by dividing channel spend by the incremental new customers generated versus a holdout group. It's the only version of customer acquisition cost that tells you what a channel actually adds.
Each version of customer acquisition cost answers a different question, and they rarely agree.
| Metric | Formula | What it shows | What it hides |
|---|---|---|---|
| Blended CAC | Total marketing spend ÷ total new customers | Overall efficiency of customer acquisition | Which channel is doing the work |
| Platform CPA | Platform spend ÷ conversions the platform claims | Performance inside one ad account | Double-counting across platforms and conversion sources |
| Multi-touch attribution CAC | Spend ÷ conversions credited by a multi-touch model | How credit spreads across touchpoints | Customers who would have bought anyway |
| Incremental CAC | Spend ÷ incremental new customers vs a holdout | What the channel truly adds | Needs a test, so it's slower to read |
Platform CPA and attribution data from Google Analytics are useful for daily optimization. For budget moves between channels, use blended and incremental CAC.
Before you call it saturation, rule out the four common false alarms. Each leaves a different pattern in the data.
| What you see | Likely cause | What to check next |
|---|---|---|
| CAC up, CPC up, conversion rates flat | Auction pressure | Auction insights for new competitors; compare marginal cost across channels |
| CAC up in the same months every year | Seasonality | Same period last year |
| CAC up and conversions down on one platform only | Tracking gap | Pixel, conversion API, and consent setup |
| CAC up and frequency up on social | Creative fatigue | Creative age and refresh rate |
| Incremental CAC up with stable inputs | True saturation | Run a reallocation test |
Move 10-30% of the shift you think is warranted first, test it against a holdout, and scale in steps only when incremental CAC on social beats the search spend you removed. Small first moves protect you if the model or the signals are wrong.
Reallocation at a flat budget can pay off when the signals are right. Google's analysis of 25 Meridian projects estimates advertisers can lift media-driven revenue or conversions by 14% by reallocating budget based on model results. The staged process below is how we keep the downside small.
The process we use:
Testing like this is becoming standard. 52% of US marketers already use incrementality tests, according to EMARKETER and TransUnion. A classic A/B testing setup won't answer the question on its own, because it compares ads within a single channel.
If you'd like help designing the holdout and reading it cleanly, the measurement team at Fieldtrip builds these tests into a reallocation plan from the start, so your digital advertising budget moves on evidence.
Judge the shift on blended CAC, MER, and new-customer volume, with branded search volume as your halo check. Platform dashboards can overstate their own contribution, so the decision should rest on business-level performance across channels.
There's a real gap here across the industry. Nielsen found that 85% of marketers say they are confident measuring ROI, yet only 32% measure it holistically across channels.
For each metric, define when to review it, what direction you want to see, and what action to take if it moves the wrong way.
| Metric | Read cadence | Direction you want | Action if it moves the wrong way |
|---|---|---|---|
| MER (revenue ÷ total spend) | Weekly | Flat or up | Pause the next tranche |
| Blended CAC | Monthly | Flat or down | Check for tracking gaps, then roll back part of the shift |
| New-customer share | Monthly | Up | Check whether social is reaching existing buyers |
| Incremental conversions vs holdout | At test end | Positive and significant | Extend the test or reverse |
| Branded search volume | Monthly | Stable or up | Expect lag; reassess after one full read window |
| Paid social frequency and CPM | Weekly | Within your Signal 7 thresholds | Add new creative before adding spend |
| Payback period | Quarterly | Flat or shorter | Check customer quality from the new channel |
Pull attribution-platform data and backend revenue data side by side so you can see both reported channel performance and the business outcome.
Move budget back when social frequency and CPM rise faster than lift, or when search starts losing impression share to budget again because social has created new branded demand. Good reallocation works in both directions.
Watch for these reverse signals:
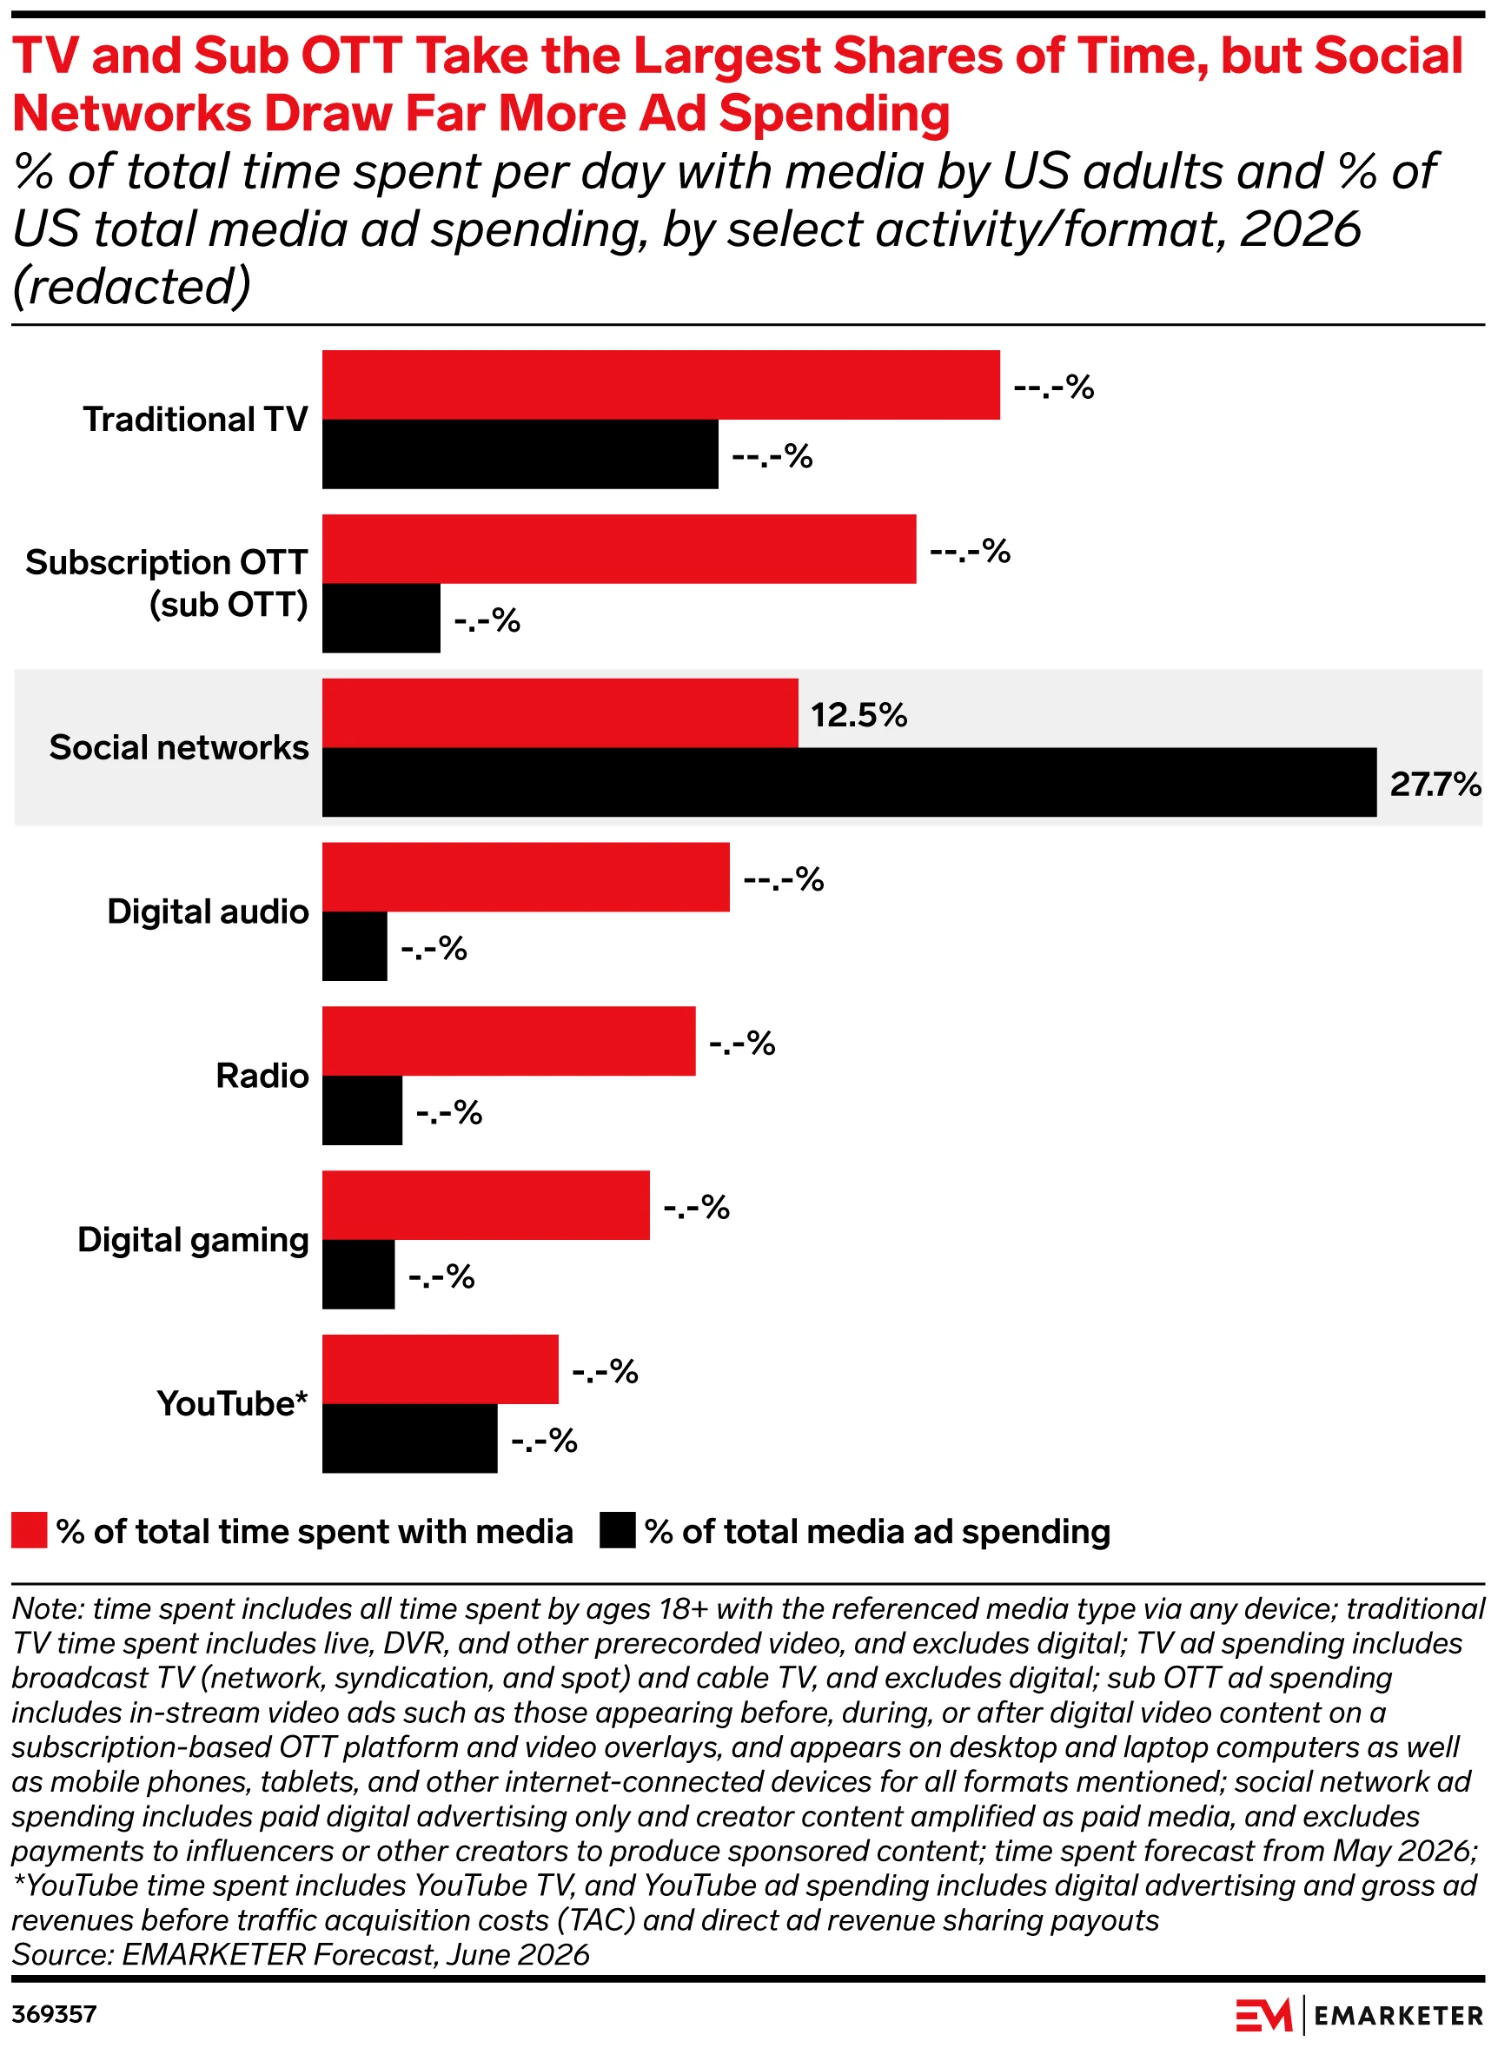
Social can be over-weighted too. EMARKETER estimates social networks take 27.7% of US ad spend but only 12.5% of consumer time with media. The same discipline applies: test, read, and move in steps.
Treat both channels as stages of one digital marketing funnel, and let the signals decide which stage needs the next dollar.
When social's ceiling is creative supply, fix that before cutting spend.
The most common mistakes are trusting platform-reported performance, cutting branded search without testing incrementality, and reacting to short-term CPA swings.
Let’s discuss them in more detail:
Each advertising platform measures performance through its own attribution system, and short measurement windows can distort the picture further.
In 15 large field experiments at Facebook, Gordon and colleagues found that observational measurement methods "often fail to produce the same effects as the randomized experiments", even after controlling for extensive user data.
Platform-reported ROAS can also overstate a channel’s incremental contribution. Read the shift on incremental and blended numbers, and use attribution models for what they're good at; Fieldtrip's comparison of multi-touch attribution vs marketing mix modeling explains where each one fits.
Branded search can still protect valuable demand when competitors bid on your brand terms. In the Bing study cited under Signal 4, brands that faced competitors but stopped advertising on their own name lost 18%-42% of their clicks to those competitors. The researchers also found strongly positive returns from defensive brand advertising.
Run a holdout before cutting brand terms, and keep them if rivals are in the auction.
Short-window triggers react to noise. Daily CPA moves with auction dynamics, day of week, and platform learning, and a large budget change can send ad sets back into the learning phase, which Meta says can mean less stable performance and a higher cost per result.
Review on a cadence that matches your attribution lag and conversion cycle, and let the Signal 5 threshold do its job.
At Fieldtrip, the paid media team manages search and social alongside creative and measurement, so budget shifts can be tested with the right ads, tracking, and decision criteria in place.
A strong media budget allocation process keeps returning to the same question: where does the next dollar produce the most incremental customer value? Fixed ratios cannot answer that on their own. Saturation curves, incremental CAC, holdout tests, and agreed review thresholds can.
That requires clear ownership, defined triggers, and a test plan before spend moves.
If you want another view on whether search has reached diminishing returns, Fieldtrip can review your spend bands, impression share, and current channel mix. We can then outline a practical first reallocation test. Talk to the Fieldtrip team.
Measure the shift on qualified pipeline or closed revenue, because cost per lead can make social look more efficient than it is. Social leads may take longer to close, so use a read window that covers your typical sales cycle. For LinkedIn Ads or Meta lead generation, compare cost per qualified opportunity with the search spend band you reduced.
They make it harder, because automated campaigns blend search with other inventory and report fewer query-level details. Separate brand and non-brand where the platform allows, and read saturation on total spend and new-customer conversions. Holdout tests matter more when you can't see what the campaign is buying.
Use a time-based test. Shift the budget for four to six weeks, hold everything else steady, and compare blended CAC and new-customer volume with the same period before. It's less precise than a geo holdout, so move smaller tranches and confirm the trend over two cycles.
Monthly for fast-moving accounts, quarterly for most others. Allegro refreshes its Meridian model monthly to keep up with market changes. Refresh sooner after a big creative change, a pricing change, or a shift in conversion rate optimization work on your site.
Judge on payback period and lifetime value. A lower CAC with a smaller first order can pay back faster or slower, depending on how often those customers buy again. Track first-order value and 90-day revenue by channel, and adjust your marketing tactics before deciding the shift failed.
%2520(1).png)