






















Marketing budgets remain largely flat. Gartner's 2026 CMO Spend Survey puts marketing budgets at 7.8% of company revenue, up from 7.7% a year earlier. With limited room to increase spending, advertisers may prioritize cheaper reach.
But lower CPMs don't always translate into better advertising results. The ANA's programmatic media study found that advertisers mostly "chase cheap CPMs" and estimated that up to $20 billion of an $88 billion market, or 23%, was waste.
This guide explains what low CPMs can hide, how cheaper media can increase customer acquisition costs, and how to evaluate a live media plan. It also covers the metrics that help advertisers measure effectiveness alongside efficiency.
If you'd like a second pair of eyes on your media spending, our media team can help assess performance across programmatic, social, CTV, and retail media.
Our point of view: a CPM is a price tag. It tells you what an impression cost and nothing about what it did.
We treat media buying as the place where strategy and creative get tested against real outcomes, so every dollar is judged by the incremental result or the learning it buys. This only works when the people setting business goals, the specialists running each channel and the analysts reading the results share one scoreboard.
When every partner reports its own efficiency number, the plan gets cheaper on paper and weaker in market.
Advertising efficiency measures how cheaply you buy delivery. Advertising effectiveness measures whether that delivery changed sales, market share or brand demand.
The general distinction is the management line usually attributed to Peter Drucker: efficiency is doing things right, effectiveness is doing the right things.
You'll also see the same distinction called marketing effectiveness vs marketing efficiency. In media, the split is sharper:
The two can move in opposite directions. Efficiency ratios improve whenever spend shifts toward cheaper inventory or toward people who were already about to buy, and neither shift creates new demand.
Les Binet and Peter Field's analysis of the IPA effectiveness databank found that short-term marketing "boosts ROI but not profit growth." That's the efficiency vs effectiveness gap in one line.
| Dimension | Advertising efficiency | Advertising effectiveness |
|---|---|---|
| Question it answers | How much did delivery cost? | What did the advertising cause? |
| Unit | Cost per impression, click or attributed action | Incremental sales, share, profit or brand demand |
| Typical metrics | CPM, CPC, CPA, platform ROAS | Incremental conversions, brand lift, market share, marketing efficiency ratio |
| Time horizon | Daily to weekly | Weeks to years |
| Usual owner | Channel specialist or media buyer | CMO, finance, growth lead |
| Measurement tool | Platform dashboard | Holdout tests, marketing mix modeling, brand tracking |
How to split budget between brand building and activation is a related but separate question. We've covered it in why brand vs. performance is a false choice. This article stays on the buying and measurement layer.
A lower CPM lowers the price of an impression. It doesn't lower the cost of an outcome, and it usually raises it, because impressions are usually cheap for a reason. They're less likely to be seen, less likely to hold attention, or served to people who are less valuable or already going to buy.
| Reason the CPM is low | What the impression actually delivers |
|---|---|
| Made-for-advertising or long-tail supply | Ad-cluttered pages with little real audience |
| Low viewability or invalid traffic | Ads no person had a chance to see |
| Low-attention placements | Ads seen for a fraction of a second |
| Lowest-cost bidding | Repeated delivery to a narrow, cheap pool of users |
| Retargeting and branded search | Credit for sales that would have happened anyway |
| Weak creative | Paid exposure that doesn't move anyone |
Made-for-advertising (MFA) sites exist to sell ad space, and they price it to win CPM-optimized buys.
In the same ANA study cited above, MFA sites took 21% of impressions but only 15% of spend, so their impressions cost roughly 30% less than the average in the sample. The same study found the average campaign in its sample ran across 44,000 websites.
That's what open-exchange buying to a CPM target rewards: a long tail of cheap pages that few people chose to visit.
Advertisers have started to tighten supply since. In the ANA's benchmark, participants directed 41% of programmatic budgets to effective ad impressions in Q1 2025, up from 36% in 2023, and MFA exposure hit a record low by Q3 2025.
We cover the shift in how programmatic media buying has evolved for large brands.
What to do: run on an inclusion list of approved domains and apps, and add an MFA exclusion list from your verification vendor.
A served impression isn't a seen one. The Media Rating Council's minimum standard counts an ad as viewable when at least 50% of its pixels are in view for one continuous second for display, or two seconds for video. That's a low bar, and plenty of cheap inventory still misses it.
DoubleVerify's 2025 Global Insights report put authentic viewability in North America at 71% in 2024, and reported that bot fraud in the region rose 101% year over year.
The first correction is viewable CPM (vCPM): cost divided by viewable impressions, times 1,000. A $4 CPM with 60% viewability is a $6.67 vCPM. A $9 CPM with 90% viewability is a $10 vCPM.
The price gap between the two plans narrows from $5 to $3.33, and that's before you ask whether anyone paid attention.
Attention is the next filter after viewability. Attention metrics estimate how long people actually looked at an ad, often by modeling eye-tracking panel data onto impression logs. On that measure, cheap formats get expensive fast.
Lumen's analysis with WARC found you'd need to buy about 40 desktop display ads to get the same attention as one average 30-second TV ad. That's 2020 data, so treat it as directional.
As reported by Mi3 in March 2026, Dr Karen Nelson-Field of Amplified has estimated that low-attention "dull" media costs advertisers US$198 billion a year, or $0.43 of every dollar spent, with the dullest media up to 12x less efficient. Treat that as a model estimate, but it points the same way as the Lumen data.
What to do: ask your verification or attention partner for attention data by placement, then compare cost per attentive second across the plan.
Bidding systems are built to hit your objective at the lowest price you allow. If the objective is cheap impressions or cheap clicks, delivery drifts to the placements, devices and users that clear the auction for the least money. Over a flight, the same pool gets hit again and again while most of the market goes unreached.
This matters because growth comes from new buyers. The same Binet and Field analysis found that penetration is three times more likely than loyalty to be the main driver of growth and profit. A plan that buys cheap frequency against a narrow audience works against that.
What to do: if a small share of users carries most of the impressions (audit step 3 below shows how to check), set a frequency cap and rebalance toward unique reach.
Retargeting and branded search often post the lowest CPAs in an account because they reach people who were already on the way to buying.
A research found that 30% of paid search is driven by brand and upper-funnel marketing, with another 30% to 60% driven by non-marketing factors such as seasonality and loyalty.
As a result, last-click attribution overstates clickable activity by 2x to 10x on average.
That's why dashboards keep recommending more of the same. The attribution model credits the last click, and the cheapest last clicks go to people who needed the least persuasion.
The trade-offs between attribution and modeling approaches are covered in multi-touch attribution vs marketing mix modeling.
CPM prices the placement and says nothing about the ad in it.
NCSolutions' meta-study of nearly 450 CPG campaigns found that creative drove 49% of incremental sales, against 21% for brand, 14% for reach, 11% for targeting and 5% for recency.
A cheap placement carrying a weak ad is the worst value in any plan, and a CPM report can't flag it. Creative and media decisions have to be read together, which is the case we make in how media and creative work together to lift ROAS.
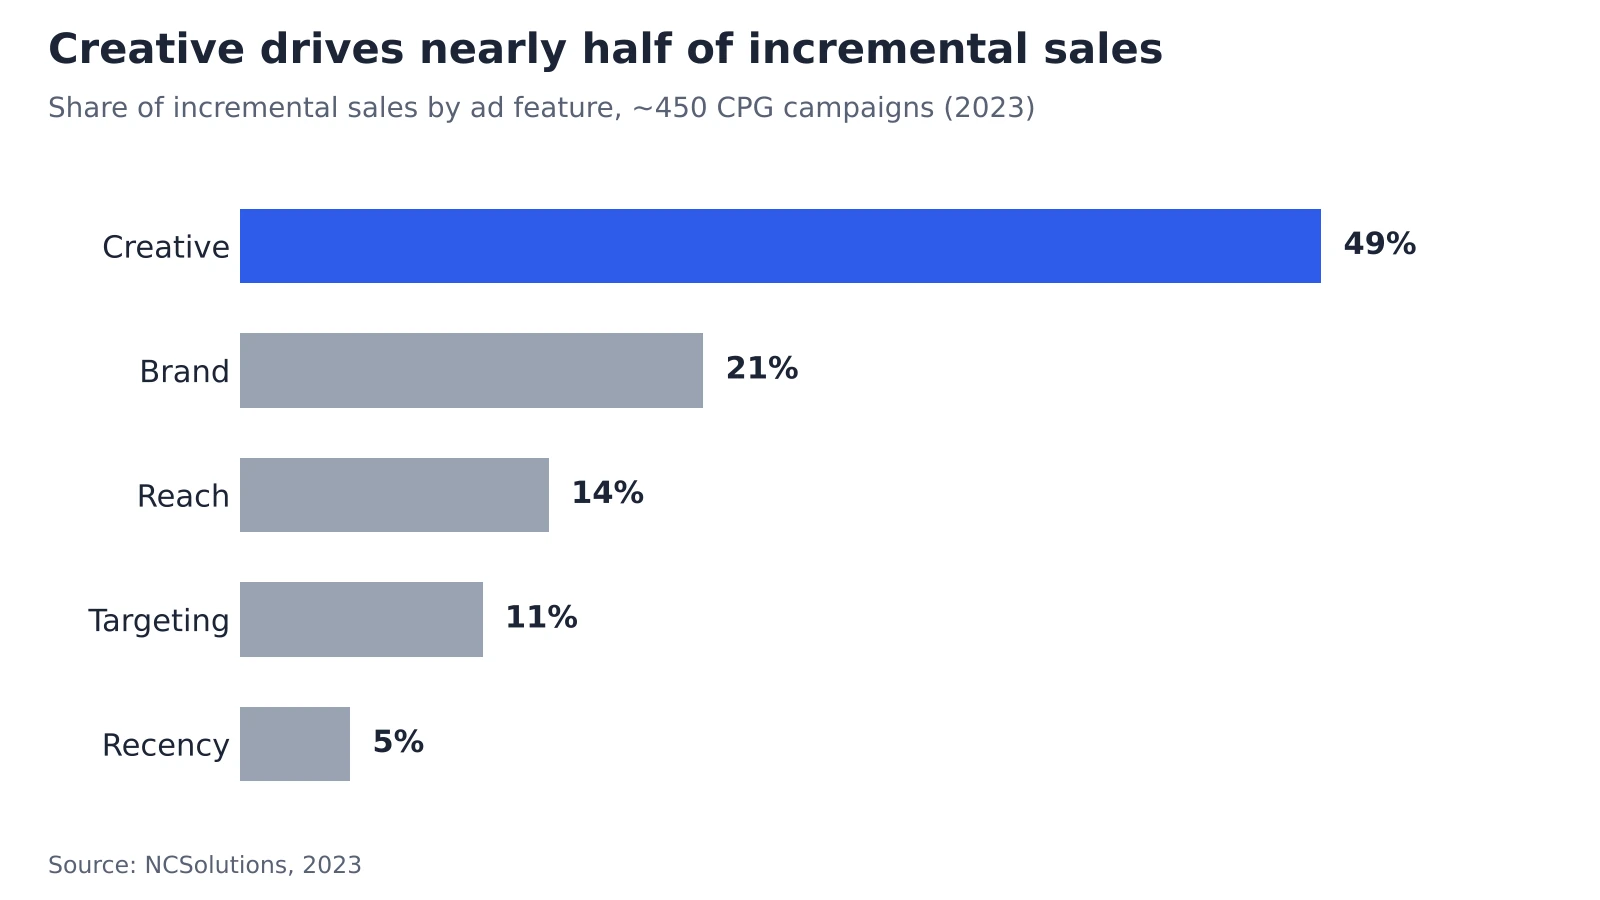
Creative drives nearly half of incremental sales in CPG campaigns, more than reach and targeting combined.
A $4 CPM plan can cost more per incremental customer than a $12 CPM plan once viewability, audience fit and incrementality are counted.
The table below uses illustrative numbers for a $100,000 budget. The figures are assumptions chosen to show the arithmetic.
| Metric | Plan A: open exchange | Plan B: curated premium |
|---|---|---|
| CPM | $4.00 | $12.00 |
| Impressions bought | 25,000,000 | 8,333,333 |
| Viewable rate | 55% | 80% |
| In-target rate (of viewable) | 50% | 75% |
| Viewable, in-target impressions | 6,875,000 | 5,000,000 |
| Effective CPM (per 1,000 viewable, in-target impressions) | $14.55 | $20.00 |
| Average attentive seconds per viewable impression | 0.8 | 2.5 |
| Cost per 1,000 attentive seconds | $9.09 | $6.00 |
| Platform-reported conversions | 1,600 | 900 |
| Platform-reported CPA | $62.50 | $111.11 |
| Incremental conversions (from holdout) | 400 | 625 |
| Cost per incremental acquisition | $250.00 | $160.00 |
Three things show up when you read down the columns:
Real programs show the same pattern. In the ANA's Q4 2025 benchmark, advertisers with strict quality controls turned 56.7% of programmatic spend into qualified impressions, against 37.5% for lower performers. The ANA added that advertiser case studies optimizing to quality-adjusted metrics saw "nearly 40% reductions in cost per conversion, even when nominal CPMs increased."
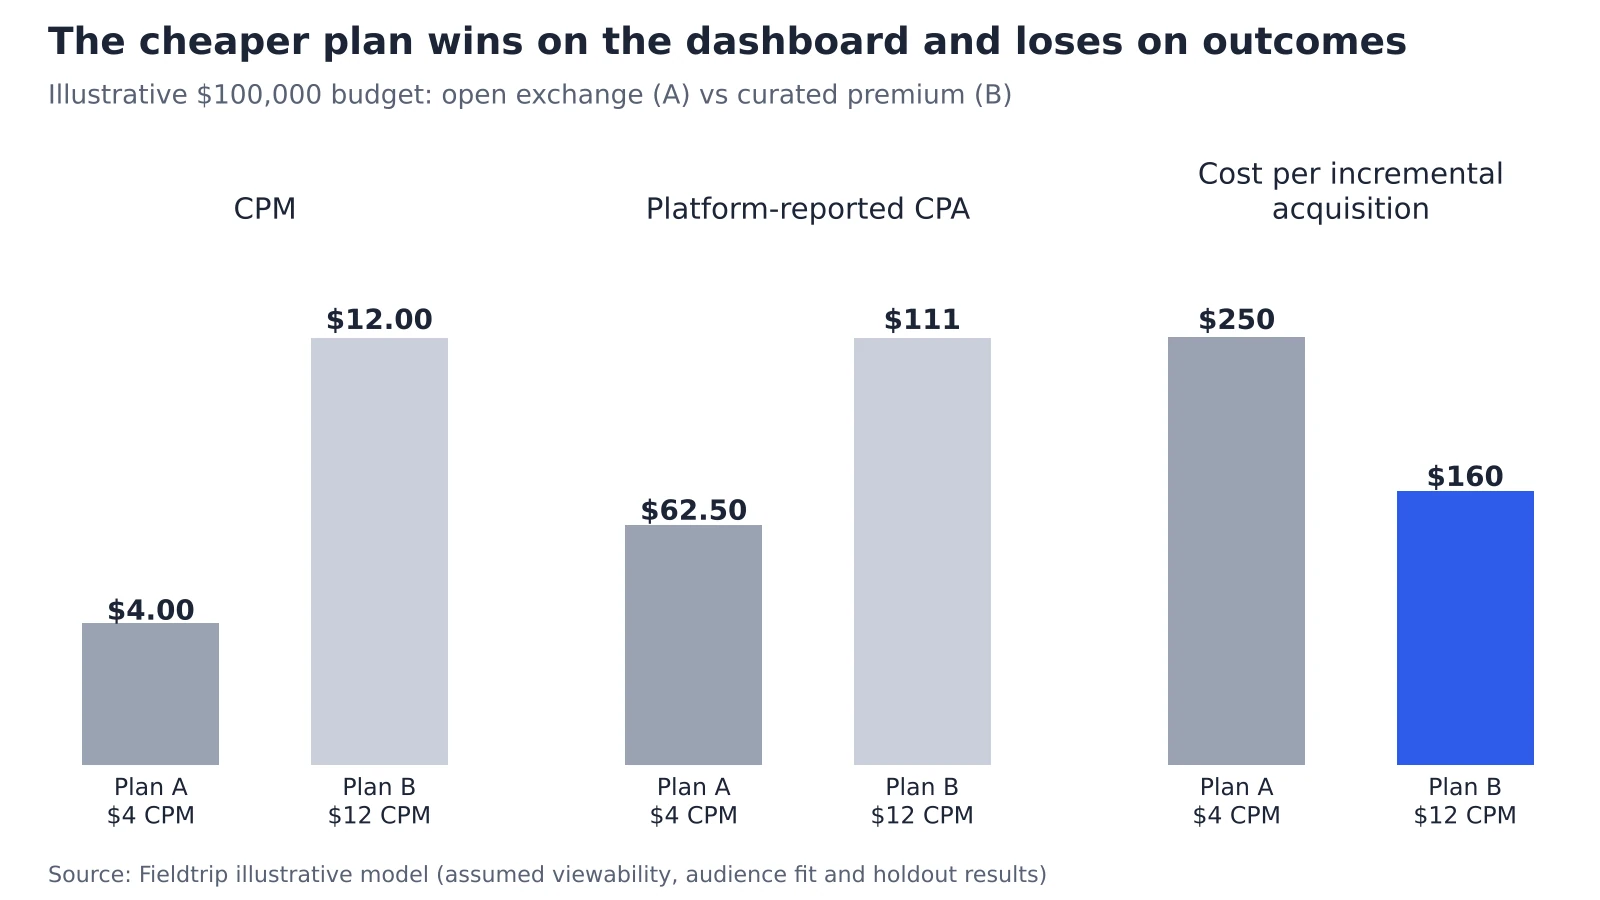
Same $100,000 budget: the lower-CPM plan wins on platform CPA and loses on cost per incremental acquisition. Source: Fieldtrip illustrative model
The clearest sign of an ineffective plan is efficiency metrics improving while business outcomes stay flat. Lower CPMs, better platform ROAS and cheaper clicks mean little if sales, new customers and brand demand aren't moving with them.
| Signal you see | What it likely means | What to check next |
|---|---|---|
| CPMs fall, sales stay flat | Delivery moved to cheaper, lower-quality supply | Domain and placement report, MFA share |
| Platform ROAS rises, total revenue doesn't | Attribution is claiming demand that already existed | Geo holdout or conversion lift test |
| Frequency rises while reach stalls | Spend is concentrating on a cheap, narrow audience | Frequency distribution and reach curve |
| Spend spreads across thousands of domains | Long-tail open-exchange buying | Inclusion list coverage and supply path report |
| Retargeting and branded search take a growing share | The plan is harvesting demand more than creating it | Incrementality test on those lines |
| Brand lift or share of search declines | Too little investment in reaching new buyers | Brand tracking against spend mix |
Share of search is one of the cheapest early warnings on that list, and we explain how to track it in our guide to share of search.
A first-pass audit takes about 30 minutes if you have access to the platforms:
Measure advertising effectiveness with four methods: quality-adjusted cost metrics for in-flight buying, incrementality tests for channel decisions, brand lift studies for upper-funnel media and marketing mix modeling for budget allocation, with marketing efficiency ratio as the business-level check.
Each one answers a different decision.
| Method | Decision it answers | Time to a read | Effort and cost | Where it misleads |
|---|---|---|---|---|
| Quality-adjusted cost metrics | Which placements to buy in-flight | Daily | Low, with a verification vendor | Says nothing about outcome |
| Incrementality tests | Whether a channel or tactic adds sales | 2 to 6 weeks | Medium, needs a holdout | Short tests miss long-term effects |
| Brand lift studies | Whether upper-funnel media changed perception | 2 to 4 weeks | Medium | Surveyed intent isn't purchase |
| Marketing mix modeling | How to allocate budget across channels | Quarterly | High, typically needs 2+ years of data | Weak on new channels without calibration |
| Marketing efficiency ratio | Whether the whole program is paying off | Monthly | Low | Can't say which channel did the work |
Quality-adjusted metrics make in-flight buying decisions sharper than raw CPM. Use
Put them where they change behavior: in buying guarantees and partner targets. A specialist paid to hit a CPM will find cheap impressions. One measured on cost per qualified impression will find better ones.
Note that publishers also use "eCPM" to mean effective revenue per thousand impressions, so define it in any contract.
Incrementality testing measures what advertising caused by comparing an exposed group with a matched group that didn't see it.
The common designs are:
Cost per incremental acquisition is spend divided by the conversions above the control baseline. That's the number to compare channels on.
Brand lift studies survey exposed and unexposed audiences to measure changes in awareness, consideration and intent. They're the right read for reach-led media, where most of the effect lands before anyone clicks. We cover scoping and sample design in how enterprise brands run brand lift studies.
They also show where extra frequency stops paying. Dynata notes that lift typically rises to an optimal exposure level, then plateaus or declines. Run studies long enough to see that curve, and use it to set frequency caps.
Marketing mix modeling (MMM) uses historical spend and sales data to estimate each channel's contribution, including long-term and offline effects that platform data can't see. It's the right tool for portfolio-level allocation across channels and quarters.
MMM works best when calibrated with incrementality test results, so each method checks the other. For setup and data requirements, see media mix modeling for enterprise marketers.
Marketing efficiency ratio (MER) is total revenue divided by total marketing spend. It's the simplest test of business value because no platform can claim credit for it.
Use MER as the reality check on platform ROAS. If every channel reports rising ROAS and MER doesn't move, the channels are sharing credit for the same customers.
A lower CPM is the right choice when media quality is held constant and the goal is reach or learning. Cheap media is a problem when the price comes from lower quality. When the price comes from smarter buying or better creative, it's a gain.
| Objective | When a lower CPM is fine | Guardrail to set first |
|---|---|---|
| Broad reach | Inventory is on a verified inclusion list | Viewability floor and MFA exclusions |
| Creative testing at volume | You need fast, cheap signal on many concepts | Judge on creative-level metrics, not channel ROAS |
| Frequency fill | The audience has already been reached on premium media | Frequency cap per user |
| Paid social | The low CPM comes from strong engagement | Check placement breakdown for low-quality placements |
The paid social case deserves a closer look. Meta's auction weighs bid, estimated action rates and ad quality, and Meta says an ad that's more relevant to a person could win an auction against ads with higher bids. A falling CPM on a strong creative can be a sign the ad is working.
The test is the placement breakdown: if the savings come from feed and story placements, good. If they come from audience network and in-app inventory, look closer.
Scale changes the risk too. Enterprise brands with large reach goals can absorb some cheap fill, while a challenger brand spending a smaller budget can't afford many wasted impressions.
Our guide to creative testing measurement for large brands covers how to read cheap test media without over-reading it.
Large organizations default to efficiency because it's the metric every dashboard reports, every specialist partner is paid on, and every procurement review can compare. None of that requires bad intentions. The system makes efficiency the easiest number to defend.
Every ad platform reports CPM, CPC, CPA and ROAS daily, for free. Effectiveness has to be designed: holdouts need planning, brand lift needs a survey partner, and MMM needs years of clean data. The number that shows up every morning ends up steering the budget.
Many enterprise brands run separate partners for programmatic, paid social, search, retail media and CTV. Each one is measured on its own cost metric, so each one optimizes for it, and no one is accountable for the combined outcome.
Adidas has described the wider efficiency mindset publicly. Quoted in Marketing Week in 2019, Adidas's Simon Peel said: "When I joined it was all about cost-efficiency."
He added: "Superficially, it looks like you're doing a great job efficiently, but actually when you're looking at measuring the success of it in terms of the business impact you're not really doing a very good job at all."
Budget pressure turns CPM reduction into the easiest win to report.
Gartner's 2025 survey found that media price inflation means CMOs are getting less for every dollar spent, and 39% of CMOs planned to cut agency budgets. When cost is the only number procurement can compare across partners, cost is what gets optimized.
The fix sits above the channels. Someone has to connect the business decision to the specialist execution and hold every partner to one shared measurement framework. That's the lead agency role our integrated marketing services are built around.
Rebalancing starts with the outcome and works back to the media metric. These steps run in order, since each one depends on the one before it.
| Layer | Metric | Owner | Cadence |
|---|---|---|---|
| Media quality | Viewability, MFA share, invalid traffic | Each channel specialist | Weekly |
| Delivery efficiency | Effective CPM, cost per attentive second | Media lead | Weekly |
| Incremental outcome | Cost per incremental acquisition | Measurement lead | Per test |
| Brand health | Brand lift, share of search | Brand lead | Quarterly |
| Business result | MER, new customers, revenue | CMO and finance | Monthly |
Our measurement team builds this kind of scorecard for clients, including the holdout design behind the incremental outcome layer.
Airbnb shows why step 4 matters. In 2020 the company cut annual marketing spend from $1.14 billion to $482 million. On its Q4 2020 earnings call, CEO Brian Chesky said traffic "came back to 95% of the traffic levels of 2019 without any marketing spend," with more than 90% of traffic direct or unpaid.
That was a pandemic year for a brand with unusual name recognition, so it isn't a case for cutting paid media. It shows how much of the demand that paid channels report can already exist.
Fieldtrip works as the lead agency that ties strategy, creative, media and measurement together. We set the business outcome with you, run specialist execution across creative and media, and build the measurement that shows what each dollar caused. The result is a plan that may cost more per impression and less per customer.
Book a call with Fieldtrip. We'll walk through your current media mix, check where low CPMs might be hiding waste, and show you which tests would answer the questions your dashboards can't.
No. A higher CPM buys a better chance of a seen, attended impression, but premium inventory can still reach the wrong audience or carry weak creative. Judge premium buys on cost per incremental outcome, the same as any other line.
Test the largest channels first and use the results to calibrate a marketing mix model, which then estimates incrementality for smaller lines. Rotate holdouts across channels over the year so each major line gets tested at least once.
Not yet as a full replacement. Viewability has an MRC industry standard, while attention vendors use different methods. A practical approach is to keep viewability as the floor and add attention as a second guarantee on the formats where it varies most.
Long enough to cover at least one full purchase cycle, and longer for considered purchases. Short-term sales often hold for a while on existing brand demand, so pair the read with brand tracking before concluding the cut was free.
Conversions arrive months after exposure, so in-flight decisions need leading indicators such as account engagement, pipeline created and branded search growth. Incrementality tests should run at the account or region level and be read against pipeline, since closed revenue lags too far behind.